Tires consume 10-15% of total fleet operating costs — ranking alongside fuel and maintenance as one of the three largest line items. Yet improper tire management costs the average commercial fleet $2,500-$4,000 per vehicle annually through premature replacements, wasted fuel, unplanned breakdowns, and avoidable safety incidents. The U.S. DOT reports that underinflated tires alone waste approximately 5 million gallons of fuel daily nationwide. This guide covers every dimension of fleet tire management: inspection protocols, TPMS technology, rotation schedules, retreading economics, inventory control, and software solutions that turn tires from a consumable expense into a managed asset. Start your free HVI trial to digitize tire inspections with photo verification and tread-depth tracking, or book a demo to see fleet-wide tire analytics in action.
Turn Your #3 Operating Expense Into a Managed, Measurable Asset
1. Why Fleet Tire Management Matters
For most commercial fleets, tires rank as the third or fourth highest cost-per-mile line item at roughly 4-5 cents per mile (ATRI/NPTC data). A 100-truck fleet spending $4,500 per vehicle annually on tires faces a $450,000 tire budget — and that's before counting the cascading costs of fuel waste, breakdown recovery, CSA score impacts, and litigation exposure from tire-related accidents. The difference between fleets that treat tires as a consumable and those that manage them as an asset is typically 25-40% in total tire cost.
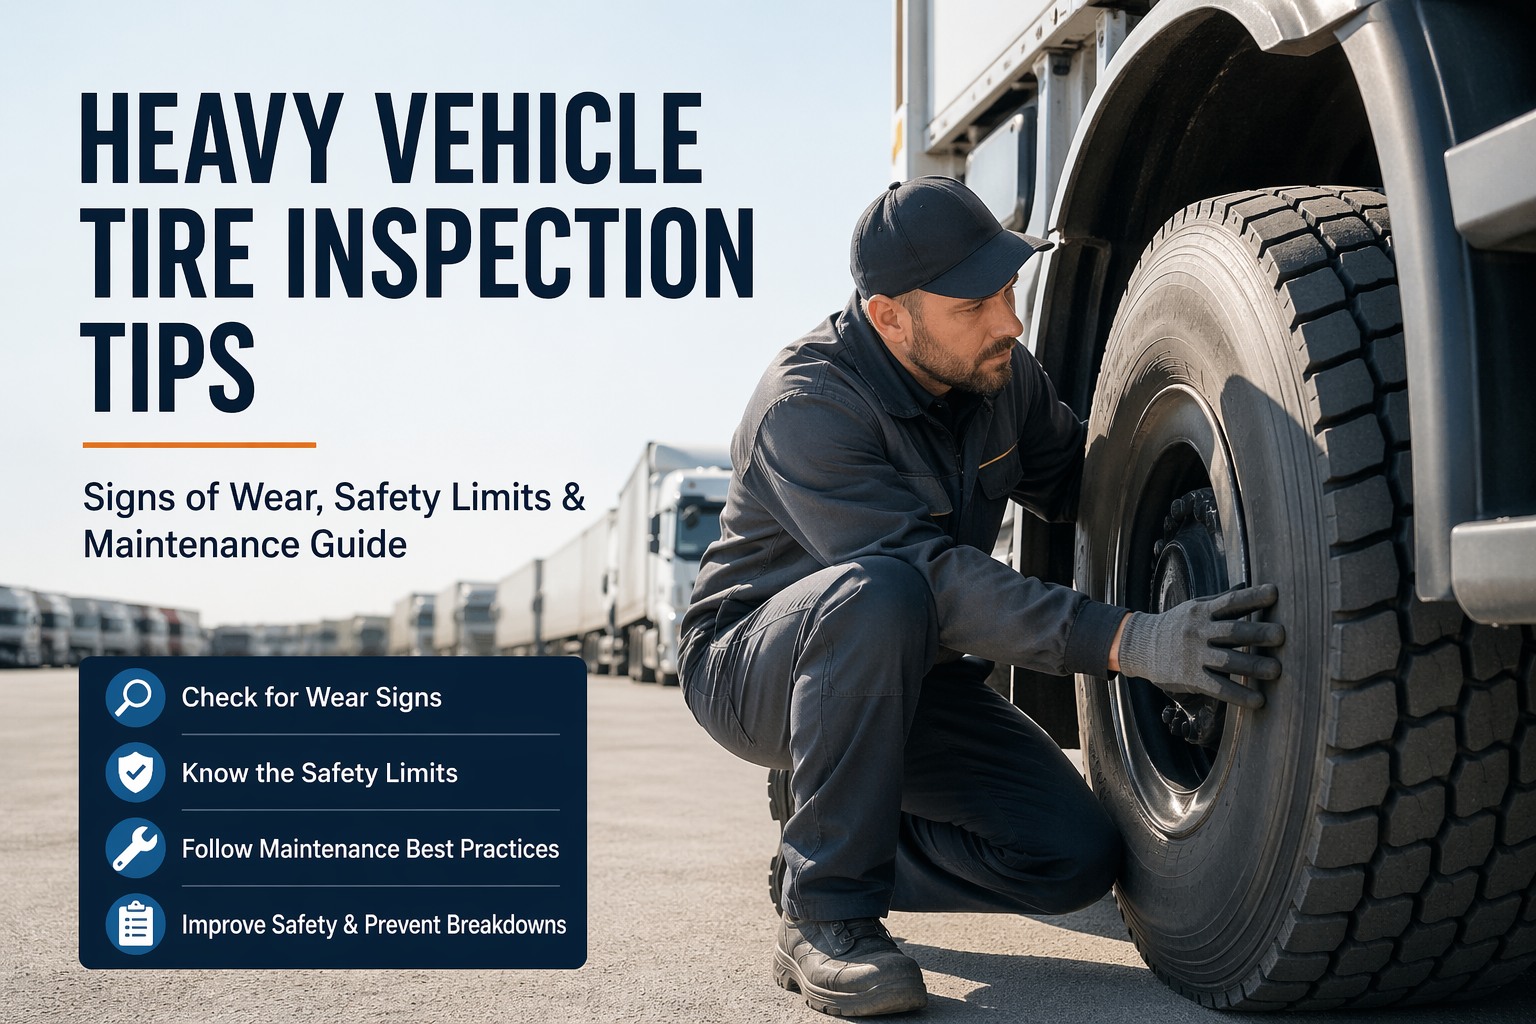
2. Tire Inspection Checklist
Tire inspections catch the defects that kill tire life, waste fuel, and trigger OOS violations. The checklist below covers every item a driver and technician should check — organized by when each inspection type should occur.
Daily Pre-Trip (Driver)
Weekly (Technician)
Monthly/Quarterly (Shop)
3. TPMS and Pressure Monitoring
The U.S. Department of Energy estimates that every 1 PSI drop in tire pressure reduces fuel economy by 0.3%. For a fleet of 50 trucks, a consistent 10 PSI underinflation across the fleet wastes roughly $10,000 in fuel annually — and cuts tire life by 10-15%. TPMS eliminates this invisible cost leak by providing continuous, automated pressure monitoring across every wheel position.
Direct TPMS
Physical sensors mounted inside each tire measure actual pressure and temperature. Data transmits wirelessly to a receiver in the cab and/or cloud dashboard.
Indirect TPMS
Uses ABS wheel speed sensors to detect pressure changes. An underinflated tire rotates at a different speed than a properly inflated one, triggering an alert.
4. Tire Rotation and Alignment Schedule
Skipping systematic rotation reduces tire lifespan by approximately 25%. A 100-truck fleet loses $75,000-$100,000 annually from this single inefficiency. Rotation equalizes wear across positions, while proper alignment prevents the accelerated degradation that renders rotation pointless.
(Class 1-3)
(Class 4-6)
(Class 7-8)
5. Retreading vs. New Tires: Cost Analysis
Nearly half of all replacement tires in the North American truck tire market are retreads. The industry's largest fleets — FedEx, UPS, Schneider National — use retreads extensively on drive and trailer positions, saving the trucking industry over $3 billion annually. The economics are straightforward: most of a tire's manufacturing cost is in the casing, and retreading reuses that investment.
6. Tire Inventory Management
Poor tire inventory practices lead to two expensive problems: either you're sitting on excess capital in unused tires (degrading in storage), or you're paying emergency premiums for urgent replacements. A disciplined inventory system eliminates both.
Standardize SKUs
Reduce tire variety to the minimum required. Every unique size, brand, and spec requires separate safety stock. Most fleets can cover 80%+ of needs with 3-5 SKUs across steer, drive, and trailer positions.
Set Par Levels by Location
Calculate minimum stock = (average weekly consumption x lead time in weeks) + safety buffer. A terminal consuming 12 tires/week with a 2-week lead time needs 24 + 6 (25% buffer) = 30 tires minimum on hand.
Track Every Tire Lifecycle
Assign a unique ID (barcode or RFID) to each tire at purchase. Track: purchase date, install date, position history, tread measurements, retreads, removal reason, and final scrap. This data feeds cost-per-mile calculations.
Manage Casing Returns
Retreadable casings are assets worth $50-100+ each. Track casings from removal through inspection, retread, and return. Implement a casing policy: which brands/models to save, maximum age, damage criteria for scrap.
Storage Best Practices
Store tires indoors, away from sunlight, ozone sources (welders, electric motors), and petroleum products. Stack no more than 6 high. FIFO rotation — oldest tires mounted first. Tires degrade even in storage; DOT date codes older than 5 years should be flagged.
7. Tire Management Software Solutions
The gap between good and great tire management is data. Software platforms transform manual inspection records and purchase invoices into actionable intelligence: cost-per-mile by brand, optimal rotation intervals for your specific routes, replacement forecasts, and vendor performance comparisons.
Digital Inspection Forms
Mobile-guided tire checks with photo capture, tread-depth input fields, and pressure readings that feed directly into analytics.
Real-Time Alerts
Automated notifications when tread depth reaches thresholds, pressure drops below targets, or tires approach manufacturer mileage limits.
Cost-Per-Mile Analytics
Compare actual CPM by manufacturer, model, position, and retreader. Identify which tire investments deliver best ROI for your specific routes.
TPMS Integration
Pull real-time pressure and temperature data from TPMS sensors into the same platform as inspection and inventory records.
Inventory & Casing Tracking
Barcode/RFID tire lifecycle tracking from purchase through every position change, retread generation, and final scrap with full audit trail.
Vendor Performance
Track dealer response times, pricing trends, retread quality rates, and warranty claim outcomes to negotiate better terms.
Frequently Asked Questions
Fleets implementing comprehensive tire management consistently reduce total tire costs by 25-40%. For a 100-truck fleet spending $450,000 annually on tires, that's $112,500-$180,000 in savings. The ROI comes from multiple compounding sources: extended tire life (15-25%), reduced fuel waste (3-7%), fewer breakdowns (80-90% reduction in tire-related events), better retread recovery rates, and optimized purchasing decisions. Most fleets see positive ROI within 12-18 months of implementation.
Yes. The NHTSA-sponsored University of Michigan study collected approximately 86,000 pounds of tire debris across five states and found that both new and retread tires are equally vulnerable to failure. The road debris people associate with retreads is actually caused by the same factors in both tire types: underinflation, road hazards, and overloading. Nearly half of all replacement truck tires in North America are retreads, and the industry's largest, safest fleets — including FedEx, UPS, and major carriers — use them extensively. Airlines retread 80% of their tires.
Without TPMS, check pressure at least weekly using a calibrated gauge on cold tires. Daily visual checks catch obvious flats but miss the 10-20 PSI underinflation that wastes fuel and kills tire life. FMCSA data shows only 46% of heavy CMV tires are within 5 PSI of target — meaning manual checking alone isn't sufficient for most fleets. If weekly gauged checks aren't realistic for your operation, TPMS pays for itself in the data gap it fills.
Legal minimums are 4/32" for steer axle and 2/32" for drive/trailer (49 CFR 393.75). However, safe retirement points vary by application: long-haul in wet climates should retire steer tires at 6/32" for hydroplaning safety, while local delivery in dry conditions can safely extend to 4/32". For retreading, remove tires before they reach legal minimums — casings worn below 4/32" on any position may have insufficient material for a quality retread.
The North American Council on Freight Efficiency rates TPMS and automatic tire inflation systems with a "high confidence" rating and ROI of less than one year. For fleets as small as 10-15 vehicles, Bluetooth-based TPMS solutions (cap sensors at $20-40 each) offer a low-cost entry point — no proprietary gateway required, just a mobile app. The math: if TPMS prevents one roadside tire failure per year ($800-1,500 including service call, tire, and downtime), it pays for itself on a 10-truck fleet.
Your Tires Are Either a Managed Asset or a $3,400/Year Leak
HVI turns every pre-trip into a tire data collection point — tread depth, pressure, photos, wear patterns — with automatic alerts when any tire approaches action thresholds. No dedicated tire hardware required.
No credit card required • Works on any smartphone • Fleet-wide tire analytics included