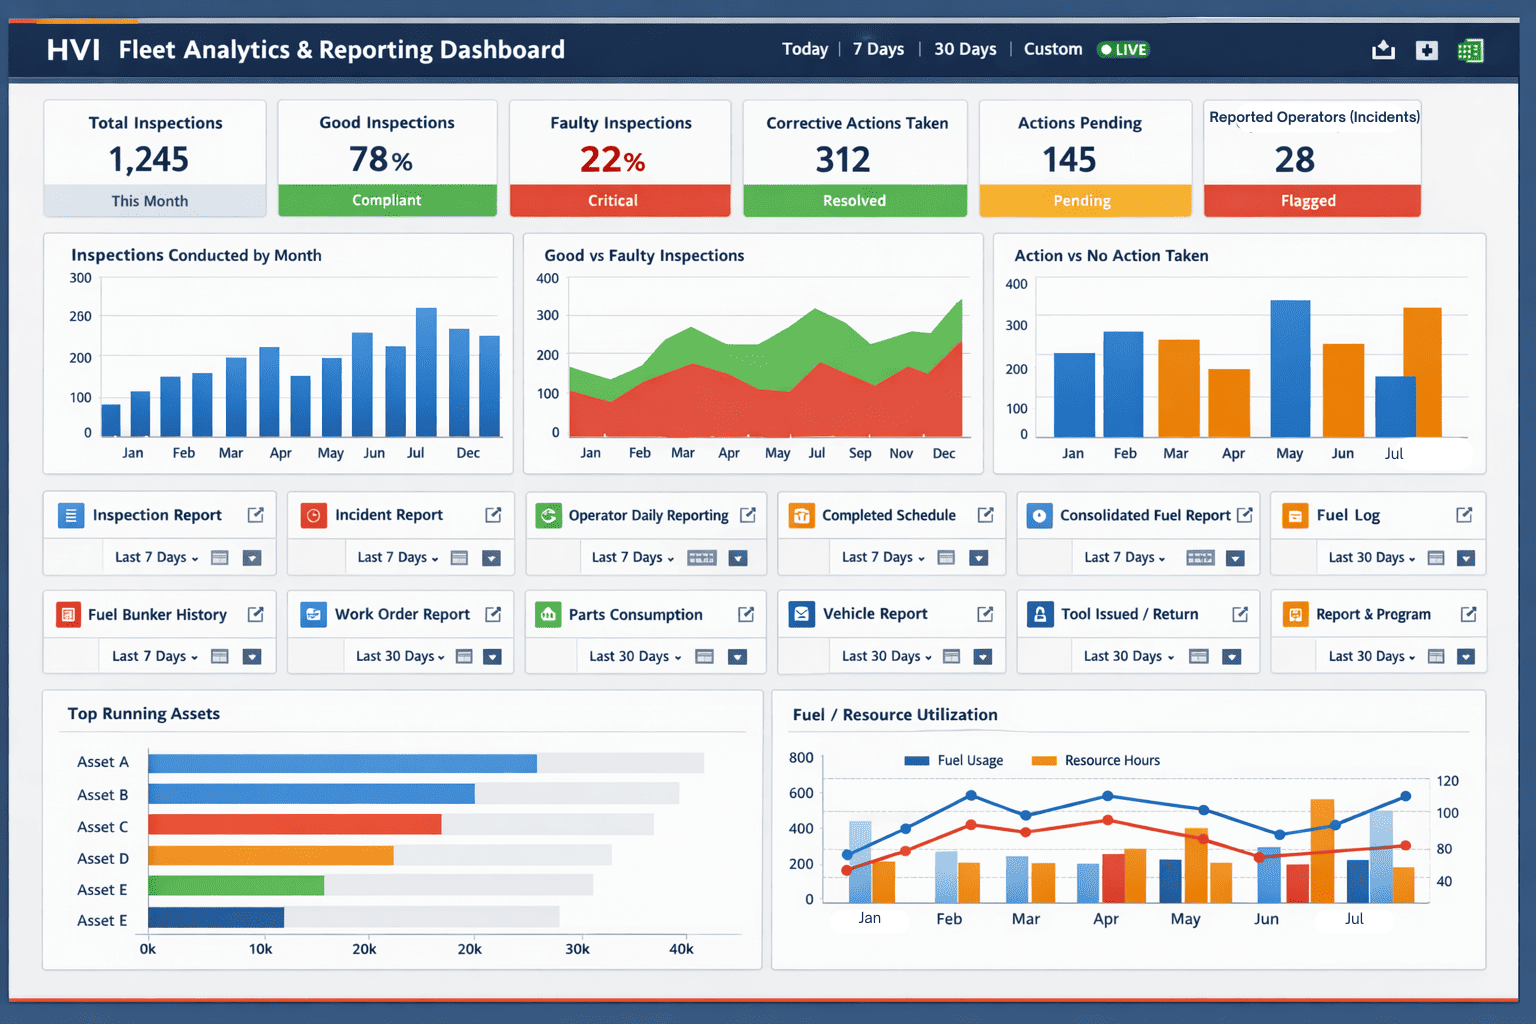
Transform Fleet Data Into Actionable Insights
Comprehensive KPI dashboards that give you complete visibility into inspections, maintenance operations, and fuel consumption. Make data-driven decisions with real-time analytics and intelligent reporting.
From Raw Data to Actionable Insights in 4 Steps
Our intelligent analytics engine automatically processes your fleet data and delivers meaningful insights in real-time
Collect Data
Mobile app and web portal capture inspections, maintenance logs, fuel entries automatically
Process & Analyze
AI-powered engine calculates KPIs, identifies trends, and flags anomalies instantly
Visualize
Interactive charts, graphs, and multi-tab dashboards make data easy to understand
Export & Share
Download comprehensive Excel reports with all metrics and custom date ranges
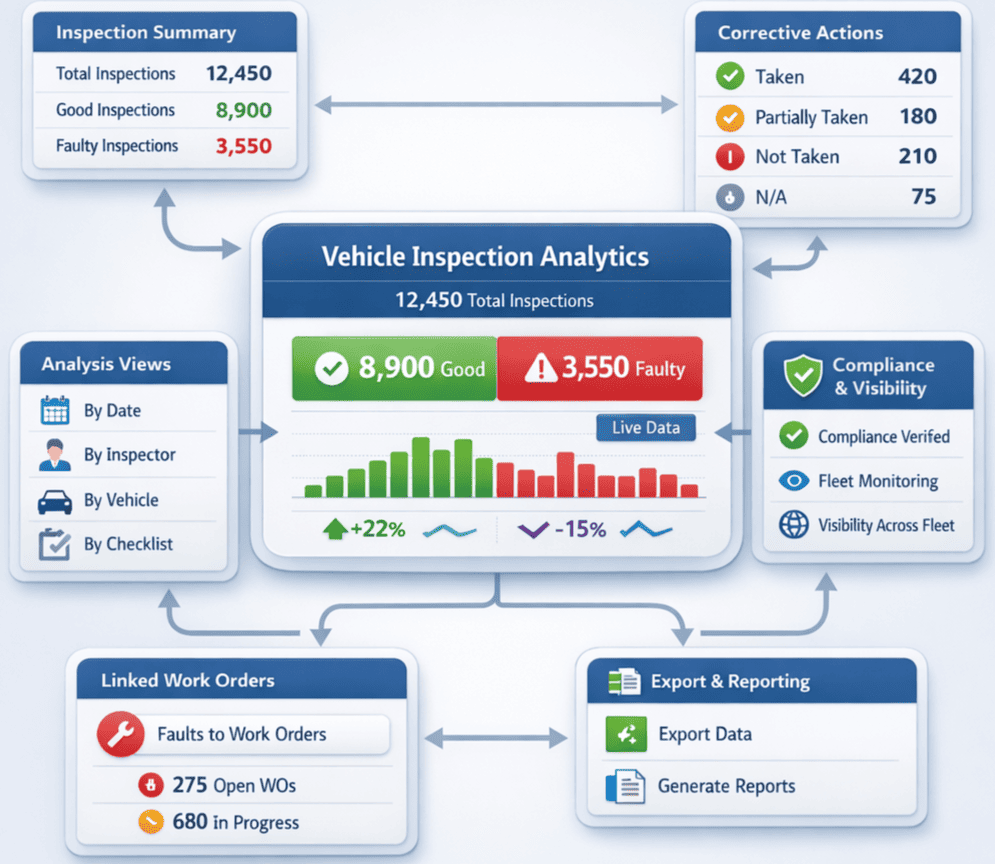
Complete Visibility Into Every Vehicle Inspection
Track inspection performance across your entire fleet with multi-dimensional analytics. Analyze by date, inspector, vehicle, category, or checklist type to identify patterns and ensure compliance.
7 Analysis Views
Overview, Datewise, Classification, By Inspector, By Vehicle, Vehicle Category, By Checklist
Good vs Faulty Tracking
Monitor pass/fail ratios with monthly trend charts and percentage breakdowns
Corrective Action Monitoring
Track Action Taken, Partially Taken, Not Taken, and NA statuses in real-time
Linked Work Orders
See which faulty inspections triggered maintenance work orders for complete workflow visibility
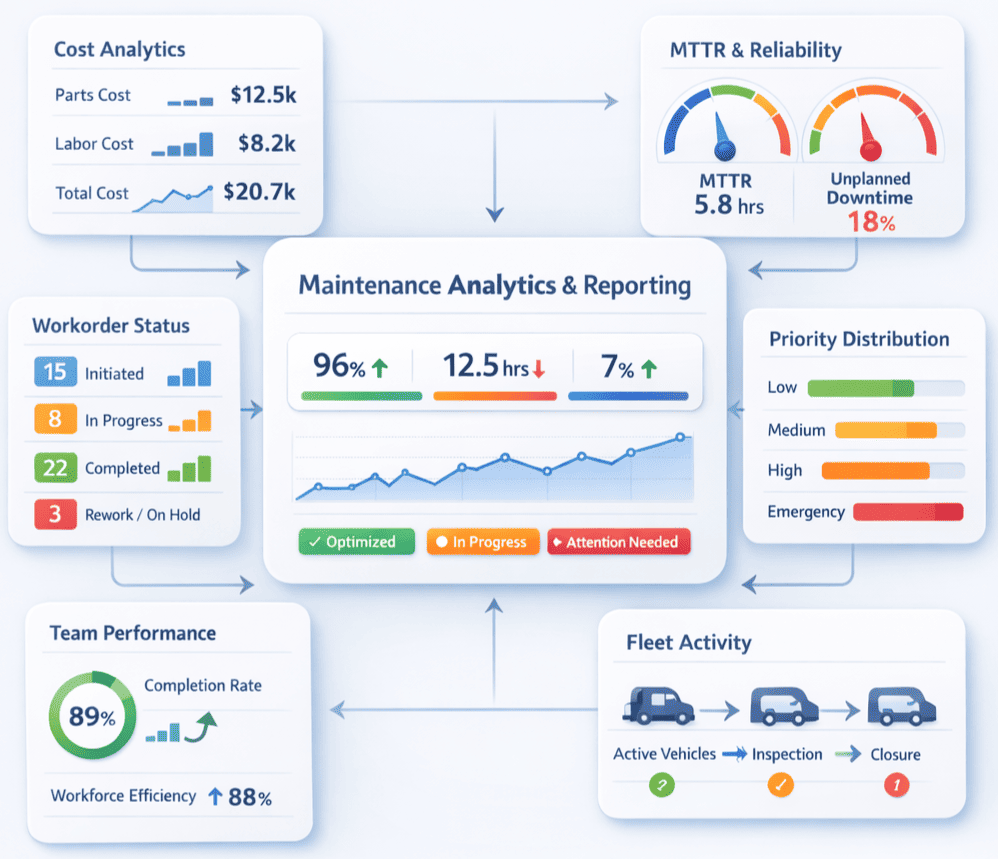
Optimize Maintenance Operations with Intelligent Analytics
Comprehensive maintenance KPI dashboard with 9 analysis tabs. Track costs, team performance, workorder status, priority distribution, and yearly trends to optimize your maintenance operations.
Cost Breakdown Analysis
Track Parts Cost, Labor Cost, and Total Cost with monthly trend charts and cost per workorder
MTTR & Performance
Mean Time To Repair, Unplanned Workorder %, Overdue Workorder tracking
Workorder Status & Priority
Initiated, In Progress, On Hold, Completed, Rework, Postponed with Low/Medium/High/Emergency priorities
Team Performance
Workorder Count and Cost by Team Member with pay sheet integration
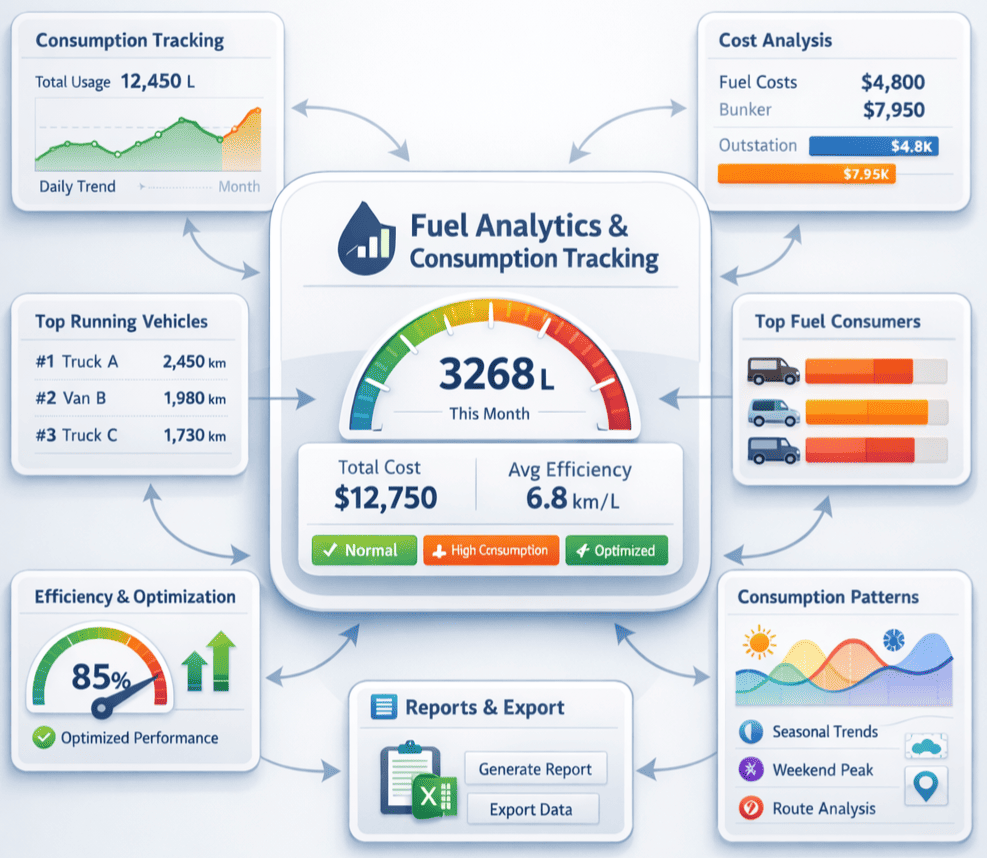
Complete Fuel Analytics & Consumption Tracking
Monitor fuel consumption, costs, and efficiency metrics across your entire fleet. Identify top-consuming vehicles, track fuel bunker usage, and analyze consumption patterns to optimize fuel management.
Consumption Tracking
Monitor total fuel logs, quantity in liters, and average daily consumption
Cost Analysis
Track total fuel cost, outstation costs, and cost per vehicle
Top Running Vehicles
Identify vehicles with highest meter readings and fuel consumption
Top Fuel Consumers
Bar charts showing highest fuel consuming vehicles by quantity
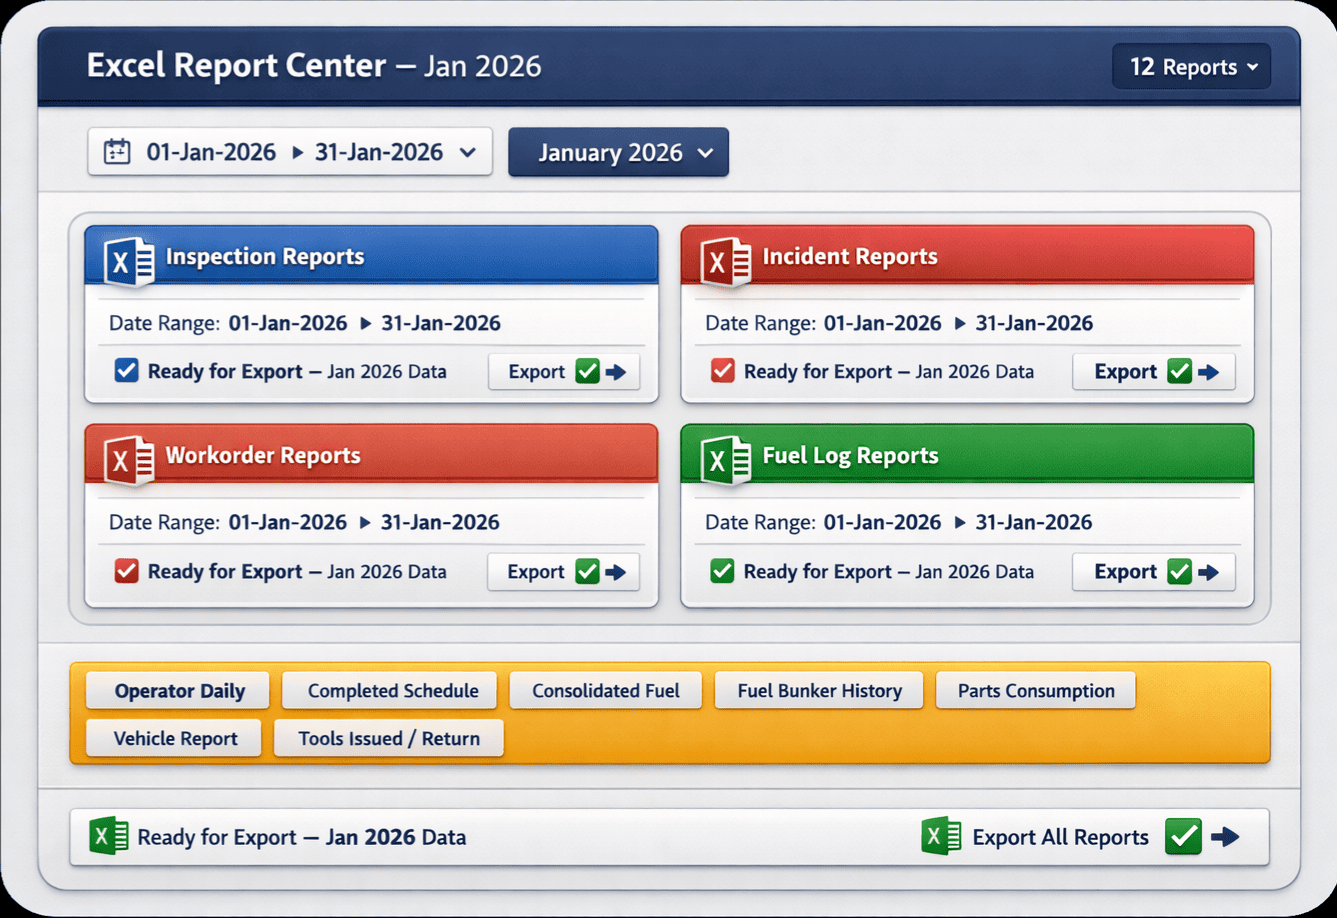
12 Comprehensive Excel Reports for Every Need
Export complete datasets for any date range with one click. All reports include full data with applied filters, ready for analysis, audits, or sharing with stakeholders.
Inspection Reports
Full inspection data, Incident reports with all details
Maintenance Reports
Workorders, Parts Consumption, Tool Issued/Return
Fuel Reports
Fuel Log, Consolidated Fuel, Bunker History
Vehicle & Operations
Operator Daily, Vehicle Report, Completed Schedules
Flexible Date Range Selection
Select any custom date range from 2022-2028. Export data by year, quarter, month, or any custom period.
Data-Driven Fleet Management Made Simple
Transform raw operational data into actionable insights that drive efficiency and reduce costs
360° Fleet Visibility
Complete view of inspections, maintenance, and fuel operations across all vehicles in real-time dashboards.
Save Hours Weekly
Eliminate manual report creation. Auto-generated dashboards and one-click Excel exports save 5+ hours per week.
Predict & Prevent
Identify trends before they become problems. Spot maintenance patterns and fuel anomalies early.
Audit-Ready Reports
Stay compliant with DOT, OSHA, and FMCSA requirements. Complete documentation for any audit.
Cost Optimization
Track maintenance costs, fuel expenses, and labor. Identify cost-saving opportunities across operations.
Multi-Site Support
Manage analytics across multiple locations. Filter by site or view consolidated fleet-wide reports.
Ready to Transform Your Fleet Analytics?
Join 5,000+ fleet managers who use HVI to make smarter, data-driven decisions every day. Get instant access to all 3 KPI dashboards and 12 Excel reports.