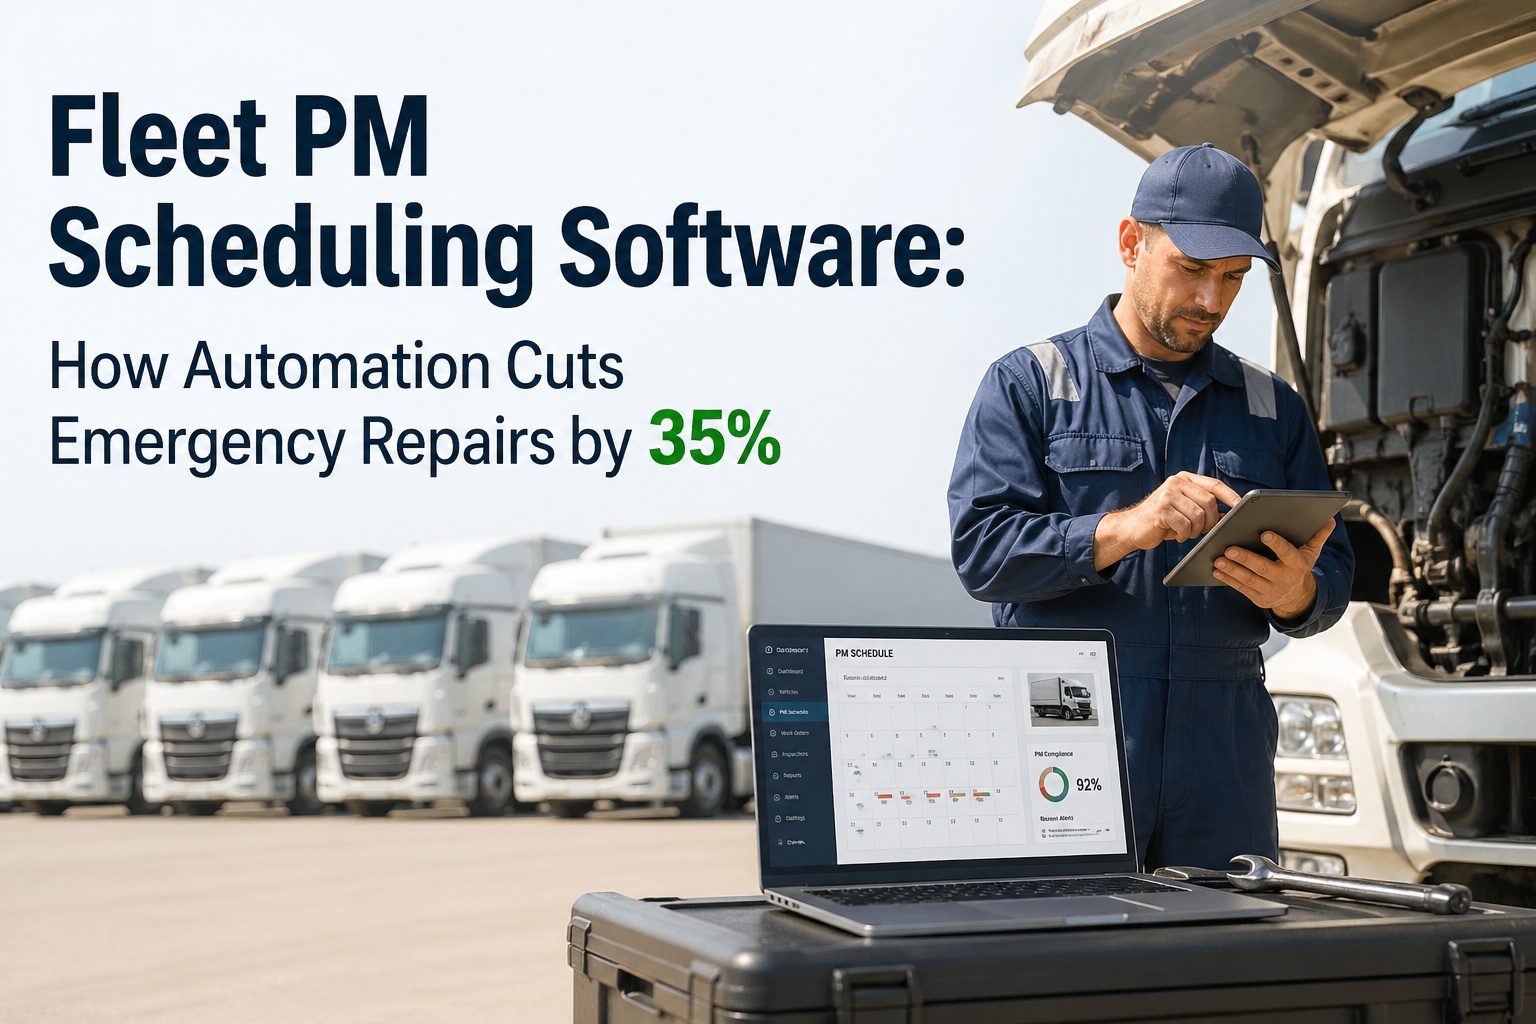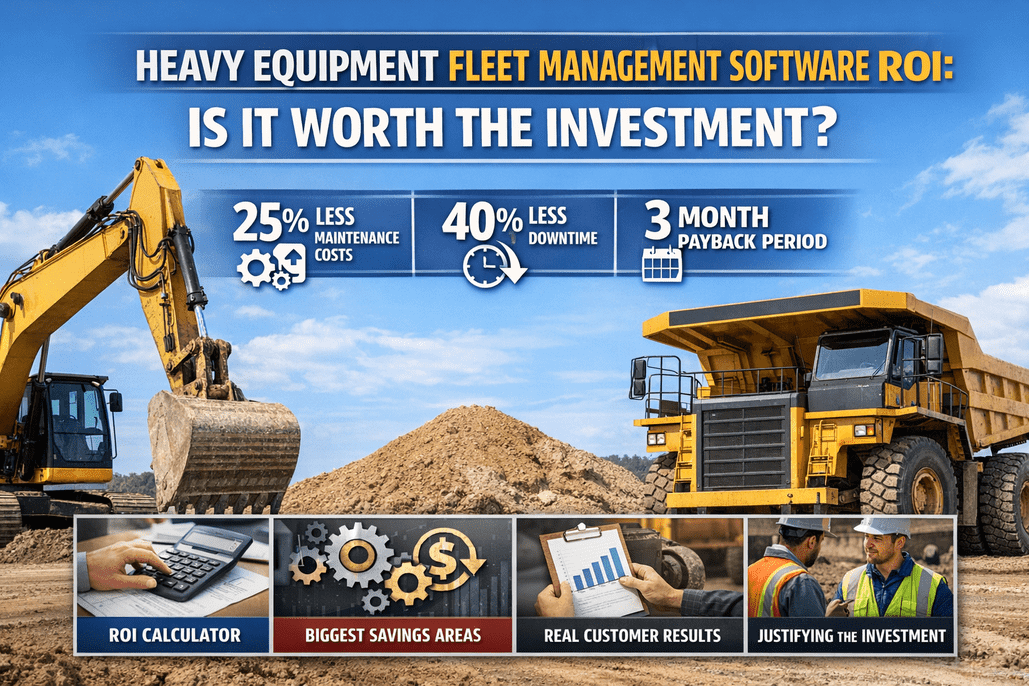
The question is not "can we afford fleet management software?" — it is "can we afford not to have it?" 82% of construction companies still rely on manual maintenance tracking, experiencing 40% higher equipment failure rates than digitally managed fleets. Emergency repairs cost 3-9x more than planned maintenance. A single unplanned breakdown on a $300,000 excavator costs $2,000+ per day in downtime. A 50-machine fleet running manual tracking loses an estimated $180,000-$250,000 per year in preventable costs — emergency repairs, parts rush orders, compliance fines, extended downtime, and equipment replacement cycles shortened by neglected maintenance. The software to prevent all of this costs 0.5-1.5% of total fleet operating costs. Industry benchmarks show 400-700% ROI within 24 months, with payback periods of 2-8 weeks for most fleets. HVI customers specifically report $185,000 average annual savings per fleet, 78% emergency repair reduction, and 94% user adoption rates. This page walks through the complete ROI calculation — what manual management actually costs, where the savings come from, real customer data, and how to build the business case that gets leadership approval. Book a demo for a personalized ROI analysis based on your fleet, or start your free trial.
Cost of Manual Management, Savings Calculator, Customer Data, Payback Analysis & Business Case Template
True Cost of Manual Heavy Equipment Management
Before calculating what software saves, you must understand what manual management costs. These are the costs that do not appear on a single invoice — they are spread across emergency repairs, overtime labor, parts rush orders, compliance fines, and shortened equipment life. They are real, they are large, and they are invisible until you measure them.
A hydraulic pump replaced during scheduled PM costs $8,000-$12,000. The same pump replaced as an emergency — with rush shipping, overtime labor, and the machine idle — costs $25,000-$50,000+. Multiply by 5-10 emergency events per year for a 50-machine fleet.
Idle crew costs, project schedule delays, equipment rental to cover the gap, contract penalty clauses. A 50-machine fleet at 20% unplanned downtime rate loses 8,000+ hours per year. At even $100/hour blended cost, that is $800,000+ annually in unproductive equipment time.
A $40 hydraulic fitting ordered normally costs $40. Ordered next-day air because the excavator is down: $80-$120. Multiply across hundreds of rush orders per year. Fleets without inventory management systems spend 25-40% more on parts than fleets with min/max stock levels and auto-reorder alerts.
133,000 annual inspection citations per year. $19,277 max fine for operating an OOS vehicle. $16,550 per serious OSHA violation. Only 7% of carriers pass a DOT audit without violations. Average: 6 violations per audit, some penalties exceeding $125,000. Digital platforms achieve 96% audit pass rate vs 73% paper.
A $300,000 excavator with systematic PM lasts 15,000-20,000 hours. Without PM, expect 10,000-14,000 hours before major overhaul or replacement. That is $60,000-$120,000 in lost asset value per machine — multiplied across the entire fleet.
Searching filing cabinets for maintenance records. Manually tracking PM due dates on spreadsheets. Phoning mechanics about work order status. Assembling audit documentation. At $75-$100/hour loaded labor cost for a fleet manager, that is $30,000-$60,000/year in administrative overhead that digital systems eliminate.
ROI Calculator Framework
This framework uses conservative industry benchmarks. Your actual savings will vary based on fleet size, current maintenance maturity, and implementation thoroughness. For a personalized analysis using your specific fleet data, book a demo.
Maintenance spend: Total maintenance labor + parts + outsourced repairs for the year. Most fleets: $3,000-$8,000 per machine per year.
Downtime cost: Unplanned downtime hours × hourly cost (direct + indirect). Conservative: $100-$500/hour. Mining/heavy construction: $1,000+/hour.
Compliance cost: Fines, audit preparation time, penalty risk. Estimate $5,000-$50,000/year depending on fleet size and regulatory exposure.
Parts premium: Estimate 25-40% of parts spend attributable to rush orders and overstocking.
Maintenance cost reduction: 25% (industry benchmark: 12-40%, use 25% conservatively)
Downtime reduction: 30% (industry benchmark: 30-75%, use 30% conservatively)
Compliance violation reduction: 40% (HVI customers report 40% fewer violations)
Parts cost reduction: 15% (from inventory optimization and elimination of rush orders)
Equipment life extension: 20% (from systematic PM, translates to deferred capital expenditure)
HVI pricing is per-vehicle with no hardware required. Industry range: $14-$60 per vehicle per month. For a 50-machine fleet at mid-range ($30/vehicle/month): $18,000/year.
Implementation: $0 (HVI requires no hardware, no consulting fees, setup in under 10 minutes). Training: minimal — guided mobile app with intuitive interface.
Total Year 1 investment: $18,000 (example — actual pricing varies by fleet size and features).
Net annual savings = (Maintenance reduction + Downtime reduction + Compliance savings + Parts savings + Equipment life extension) – Software cost.
Example: 50-machine fleet with $400K maintenance spend, $300K downtime cost, $20K compliance risk, $100K parts spend. Conservative savings: $100K maintenance + $90K downtime + $8K compliance + $15K parts = $213K. Minus $18K software = $195K net savings. ROI: 1,083%. Payback: ~5 weeks.
3 Areas of Biggest Savings
The single largest savings category. Pre-shift digital inspections catch defects before they become failures. PM scheduling ensures service happens on time. Parts availability means repairs happen immediately, not after a 2-week wait. Emergency repairs that cost 3-9x planned maintenance are replaced by scheduled maintenance at standard cost. HVI customers report 78% reduction in emergency repairs.
Every hour a machine runs instead of sitting idle is productive revenue. Reducing unplanned downtime from 20-30% to 5-10% adds thousands of productive hours per year across the fleet. For a 50-machine fleet, moving from 80% availability to 92% availability adds 9,600 productive hours — worth $480K-$960K at $50-$100/hour utilization value.
Systematic PM done at the right interval — not too early (wasting parts life), not too late (risking failure). Parts inventory optimized: no overstocking, no stockouts. Technician labor allocated efficiently through digital work orders instead of verbal assignments. Administrative overhead reduced 8-12 hours/week. Total maintenance cost per hour per machine drops 25-40%.
Real HVI Customer Data
Across HVI fleet operators, the average annual savings from transitioning paper-based maintenance to HVI's digital platform. Savings come from: eliminated emergency repairs, improved PM compliance, reduced parts waste, and fewer compliance violations. Fleets range from 20 to 500+ machines.
HVI customers report 78% fewer emergency repairs after implementing digital pre-shift inspections and automated PM scheduling. The mechanism: defects caught during daily inspections get routed to maintenance immediately, instead of discovered when the machine fails in the field.
Arizona copper mine, 215 units: 42% reduction in unplanned downtime, $3.2M annual savings. Investment: $910K. ROI: 352%. Payback: 3.4 months. Savings breakdown: reduced downtime ($1.95M), lower emergency repair costs ($680K), optimized inventory ($285K), extended equipment lifespan ($195K), reduced insurance premiums ($90K).
Software only delivers ROI if people actually use it. HVI's mobile-first design, guided inspection prompts, and offline capability drive 94% adoption — meaning operators and technicians actually complete inspections and work orders, not work around the system. Low adoption = low ROI. High adoption = compounding returns.
Payback Period Analysis
Payback: 4-8 weeks
Annual savings: $25,000-$75,000
Annual cost: $4,000-$12,000
Even small fleets see significant ROI because the per-vehicle savings (eliminated emergency, improved availability) far exceed the per-vehicle software cost. The first prevented breakdown pays for 6-12 months of software.
Payback: 2-6 weeks
Annual savings: $75,000-$250,000
Annual cost: $10,000-$40,000
Sweet spot for ROI. Large enough for savings to compound across machines, small enough for rapid implementation. Most mid-size fleets achieve positive monthly ROI within 60 days of full deployment.
Payback: 2-4 weeks
Annual savings: $250,000-$3,000,000+
Annual cost: $40,000-$150,000
Fastest payback. Volume amplifies every saving. The mining case study: 215 units, $910K investment, $3.2M annual return = 3.4-month payback, 352% ROI. Every 1% improvement in availability across 100+ machines generates massive productivity gains.
How to Justify the Investment to Leadership
Do not start the conversation with software features. Start with what manual management is currently costing: $X in emergency repairs, $Y in downtime, $Z in compliance risk. Calculate your fleet's "hidden cost" using the framework above. The software cost is 0.5-1.5% of total fleet operating costs — it reduces the other 98.5% by 10-25%. That is the business case that gets approved.
Pull your last 12 months of maintenance records. Count emergency work orders. Calculate total downtime hours. Add up rush shipping charges. Total compliance penalties. These are your numbers, not industry averages — they are irrefutable. If you do not have this data (because it is in filing cabinets and spreadsheets), that itself is the problem the software solves.
CFOs think in payback periods, not annual ROI. "This pays for itself in 5 weeks" is more compelling than "this has a 1,000% ROI." Show month-by-month cash flow: Month 1 (software cost + implementation = $X), Month 2 (first savings appear from PM compliance and defect detection), Month 3+ (cumulative savings exceed cumulative cost — positive ROI from this point forward).
Equipment failures do not stop because you delayed the software purchase. Every month without systematic maintenance is another month of accumulated risk: the next OSHA fine, the next unplanned breakdown, the next audit failure. The cost of waiting is not zero — it is the ongoing cost of manual management multiplied by every month of delay. The question is not "can we afford it?" — it is "can we afford another year without it?"
Frequently Asked Questions
Industry benchmarks show 400-700% ROI within 24 months. HVI customers average $185,000 annual savings per fleet. A 50-machine fleet typically achieves $180,000-$250,000 annual savings with payback periods of 2-8 weeks. The mining case study achieved 352% ROI ($3.2M annual savings on $910K investment) with 215 units. Conservative first-year projections: 25% maintenance cost reduction, 30% downtime reduction, 40% fewer compliance violations.
Typical payback: 2-8 weeks for most fleets. Small fleets (10-25): 4-8 weeks. Mid-size (25-100): 2-6 weeks. Large (100+): 2-4 weeks. Savings appear immediately from prevented emergency repairs and improved PM compliance. Most fleets see positive monthly ROI within 60 days of full implementation. The first prevented major breakdown often pays for 6-12 months of software cost.
Eliminated emergency repairs — typically $125K-$185K/year for a 50-machine fleet. Emergency repairs cost 3-9x planned maintenance due to rush parts, overtime labor, and production losses. HVI customers report 78% reduction in emergency repairs through daily digital inspections that catch defects before they become failures. The second largest saving is improved equipment availability (more productive hours per machine).
HVI is per-vehicle pricing with no hardware costs and no consulting fees. Industry range: $14-$60 per vehicle per month depending on features. For a 50-machine fleet at mid-range: approximately $18,000/year. HVI offers a free trial with no credit card required. The software cost represents 0.5-1.5% of total fleet operating costs — while reducing the other 98.5% by 10-25%. Book a demo for a tailored quote based on your specific fleet.
Lead with the cost of doing nothing — calculate your current emergency repair spend, downtime cost, and compliance risk in dollars. Show the payback timeline in weeks, not years. Frame software as 0.5-1.5% of operating costs that reduces the other 98.5%. Use your own 12-month maintenance data, not industry averages. Address the risk of inaction: every month of delay is another month of accumulated preventable costs. HVI offers a free trial to prove value before full commitment.
Every fleet size sees positive ROI, but larger fleets see faster payback and higher absolute savings because per-machine savings compound. Small fleets (10-25): $25K-$75K annual savings. Mid-size (25-100): $75K-$250K. Large (100+): $250K-$3M+. Even a 10-machine fleet benefits — the first prevented breakdown covers months of software cost. The per-vehicle savings (typically $2,000-$5,000/vehicle/year) exceed per-vehicle software cost ($200-$700/vehicle/year) at every scale.
The Math Is Simple — Every Month Without Digital Management Costs You Money
HVI customers save $185K/year average. 78% fewer emergency repairs. 42% downtime reduction documented. Payback in weeks, not years. Free trial — prove the ROI with your own fleet before committing.
No credit card • No hardware • No consulting fees • Setup in 10 minutes