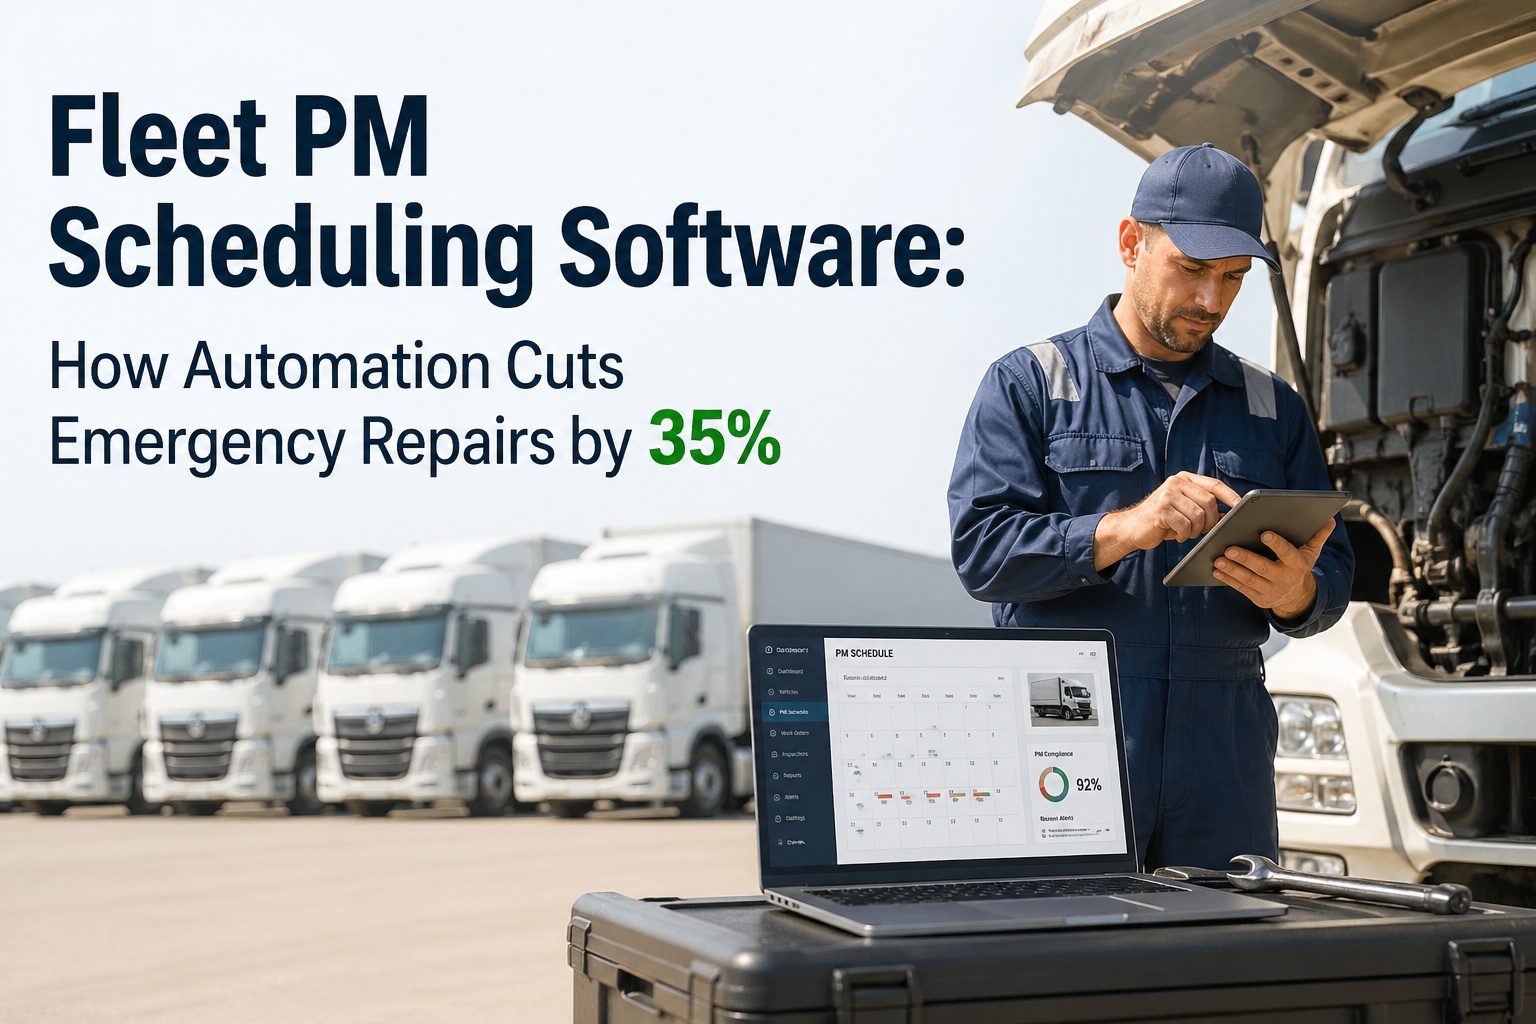
The total cost per mile to operate a single truck hit a record $2.27 in 2023 — a 33% increase from $1.67 in 2019, according to the American Transportation Research Institute. Repair and maintenance alone accounts for $0.202 per mile, representing 8.9% of total fleet operating expenses. For heavy-duty fleets in the U.S., the annual repair and maintenance cost per truck averages $16,192. Parts costs rose 3.7% year-over-year through Q4 2025 while labor costs moderated slightly. Tariff-driven increases on steel and aluminum components (50% Section 232) are flowing directly into brake parts, chassis hardware, and structural components — adding further upward pressure. The repair cost problem is not the individual bill. It is the compound effect: reactive repairs cost 3-9x more than planned maintenance, emergency shipping adds 3-5x to parts costs, downtime costs $448-$760 per day per vehicle in lost productivity, and every unplanned breakdown cascades into schedule disruptions, overtime labor, rental equipment, and customer penalties. Yet the industry average for planned-vs-reactive maintenance is only 55:45. The target is 80:20. A 50-vehicle heavy fleet spending $200,000 annually on maintenance can expect $60,000-$80,000 in first-year savings from structured cost management — reduced emergency repairs, extended component life, and lower labor costs through optimized scheduling. Most fleets see positive ROI within 6-14 months. This guide covers the complete repair cost management framework for U.S. heavy vehicle fleets: where repair dollars actually go, how to track costs at the vehicle level, the repair-vs-replace decision framework, vendor cost strategies, and the KPIs that separate cost-controlled fleets from reactive operations. Book a demo to see HVI's repair cost tracking and fleet maintenance management platform, or start your free trial of HVI's work order, parts, and cost tracking system for heavy vehicle fleets.
Fleet Repair Cost Management: Track and Reduce Heavy Vehicle Expenses
U.S. heavy fleet repair benchmarks, cost-per-vehicle tracking, repair vs replace decisions, vendor negotiation strategies, and the KPIs that control maintenance spending.
Record cost per mile to operate a truck (ATRI 2023)
R&M cost per mile — 8.9% of total operating costs
Average annual R&M cost per heavy truck in the U.S.
Reactive repair cost multiplier vs planned maintenance
Average planned vs reactive ratio (target: 80:20)
First-year savings for 50-vehicle fleet with structured cost mgmt
Where Heavy Fleet Repair Dollars Actually Go
Understanding your cost composition is the first step to controlling it. Most U.S. heavy fleets allocate maintenance budgets across these categories — but few track them accurately enough to optimize each one.
Routine PM, inspections, planned component replacements. Oil changes, filter replacements, brake adjustments, fluid flushes, tire rotations. This is your lowest cost-per-event category — and the one that prevents the expensive categories below. Every dollar spent here saves $3-9 in reactive repairs.
Breakdowns, emergency repairs, component failures. The most expensive category per event: 3-9x planned maintenance cost. Includes emergency towing ($300-$1,500), emergency parts shipping (3-5x standard), overtime labor, and the cascade of schedule disruptions. The goal is to shrink this category every quarter.
Engine rebuilds ($15,000-$35,000), transmission replacements ($8,000-$18,000), differential overhauls ($5,000-$12,000), hydraulic pump replacement ($8,000-$25,000 for heavy equipment). These are the repair-vs-replace decision triggers. Proper cost tracking reveals when a vehicle crosses the replacement threshold.
Fluids, filters, belts, hoses, light bulbs, wiper blades, and other regularly replaced items. Low cost per unit but high volume across a fleet. Bulk purchasing reduces per-unit cost 15-25%. Vendor price comparison prevents overpaying on commodity items.
Downtime ($448-$760/day per vehicle), administrative overhead (8-12% of direct costs), towing, rental equipment to cover gaps, missed delivery penalties, overtime labor for rushed repairs, and lost customer goodwill. Industry research shows indirect expenses add 35-45% on top of direct parts and labor costs. Most fleets do not track this category at all.
Work sent to third-party shops. Smaller U.S. fleets handle only 48% of maintenance in-house vs 62% for large fleets (ATRI). Every dollar at shop labor rates ($125-$175/hr) vs in-house ($45-$75/hr) directly impacts cost per mile. Track outsourced-vs-in-house ratio as a cost KPI.
Cost-Per-Vehicle Tracking: The Foundation of Repair Cost Control
Fleet-wide averages hide the vehicles that are bleeding money. You need cost visibility at the individual vehicle level — every work order, every part, every labor hour attributed to the specific truck or machine that consumed it.
Total maintenance cost divided by miles driven. Industry benchmark for well-maintained Class 8 trucks: $0.12-$0.18/mile. The ATRI average is $0.202/mile. Trucking/logistics fleets average $0.31/mile total CPM. Track monthly per vehicle. Rising CPM on a specific vehicle signals increasing maintenance burden — a leading indicator for replacement timing. Vehicles over 10 years old cost up to 35% more per mile to operate.
Average total cost (parts + labor + vendor) per completed work order. Track separately for planned vs reactive. Reactive work orders should consistently show higher average costs — this proves PM value to management. If planned and reactive costs are similar, your PM program is not preventing the expensive failures it should.
For heavy equipment (excavators, loaders, dozers) that track hours instead of miles. Total maintenance cost divided by operating hours. Compare identical machines: if Excavator A costs $28/hr to maintain and Excavator B costs $19/hr, Excavator A has a problem that needs investigation — or it is approaching end-of-life.
Annual maintenance cost as a percentage of current market value. Replace when annual maintenance exceeds 40-45% of current value. For most U.S. commercial vehicles, this occurs between years 6-8 or 400,000-600,000 miles. Monitor quarterly. Vehicles with clean maintenance histories command 20-30% higher resale values.
Repair vs Replace: The Data-Driven Decision Framework
Hold vehicles too long and escalating repair costs overwhelm depreciation savings. Replace too early and you forfeit remaining useful life. The answer is not arbitrary — it is in your cost data.
During months 0-36: minimal maintenance — primarily routine PM covered by warranty. Years 3-5: gradual cost increase as wear items need replacement. After year 6: major component failures accelerate rapidly. The break-even analysis compares current vehicle maintenance cost trajectory against new vehicle total cost of ownership. The inflection point is specific to each vehicle — not a fleet-wide average.
When annual maintenance cost exceeds 40-45% of the vehicle's current fair market value, replacement is typically more cost-effective. Example: a truck worth $35,000 that costs $15,750/year to maintain (45%) is past the crossover point. This calculation requires accurate, vehicle-specific cost data from your work orders — fleet averages will not tell you which specific truck to replace.
Cost-per-repair alone is misleading. A vehicle that costs $8,000/year in repairs but is down 45 days for those repairs costs more in total (repair + downtime at $500-$760/day = $22,500-$34,200 in downtime alone) than a vehicle costing $12,000/year in repairs with only 8 days of downtime. Include downtime cost in every repair-vs-replace calculation.
Vehicles with complete, documented maintenance histories command 20-30% higher resale values than identical vehicles without records. A $50,000 truck with full digital maintenance history sells for $60,000-$65,000. The same truck without records sells for $42,000-$50,000. Your work order system is not just a cost tracker — it is a resale value builder.
Vendor Negotiation and Cost Reduction Strategies
U.S. fleets with in-house maintenance programs have lower per-mile repair costs (ATRI data). LTL carriers do 78% in-house. Truckload carriers: 55%. Flatbeds: 45%. Every repair sent to a third-party shop at $125-$175/hr vs your in-house rate of $45-$75/hr is a measurable cost difference. Track the ratio. Identify which repair types should move in-house and which legitimately require outsourced expertise.
Reman starters, alternators, turbochargers, brake calipers, and injectors deliver 70-90% of OEM service life at 40-60% of cost. DTNA has targeted aftermarket replacement solutions for low-volume legacy parts. Penske reported recalibrating vendor strategies during the freight recession — diversifying sources to avoid single-supplier risk. Track reman vs OEM performance in your CMMS to build data-driven sourcing decisions.
Parts replaced under warranty represent direct cost recovery — but only if failures are documented properly, warranty dates are tracked, and claims are filed promptly. Systematic warranty tracking recovers 3-8% of annual parts spend. For a fleet spending $500,000/year on parts, that is $15,000-$40,000 in recovered costs. HVI flags warranted component failures for claim submission automatically.
Bulk purchasing reduces per-unit cost 15-25% on commodity items (filters, fluids, hardware). Negotiate fixed pricing agreements with primary vendors for 6-12 month terms to hedge against tariff-driven price increases. Steel and aluminum tariffs (50% Section 232) are actively inflating brake component, chassis part, and structural hardware prices in 2025-2026. Price locks protect your budget.
Repair Cost KPIs for U.S. Heavy Fleets
If you track nothing else, track these six metrics. They give you the biggest cost visibility for the effort invested and form the foundation of fleet financial management.
Track monthly per vehicle. Rising CPM is the earliest signal of a vehicle approaching replacement threshold or a maintenance process problem.
Every 10% shift toward planned reduces costs because reactive repairs cost 3-9x more. The single most revealing metric of maintenance program financial maturity.
Emergency shipping costs 3-5x standard. Declining emergency order frequency = improving inventory management and parts forecasting. A leading indicator of cost control improvement.
Long MTTR = high downtime cost. Usually indicates parts availability problems or assignment delays. Each hour of MTTR adds $50-$95 in indirect costs (downtime, admin, scheduling disruption).
Every dollar at $125-$175/hr shop rates vs $45-$75/hr in-house is a measurable margin impact. Identify repair types where in-house capability would deliver ROI.
Organizations using systematic budget processes achieve 85-95% accuracy vs 60-75% for simple historical escalation. Monthly review enables course correction before annual overruns.
HVI Repair Cost Management for Heavy Vehicle Fleets
HVI connects every repair cost to the specific vehicle, work order, technician, and part that generated it. Cost data is not an afterthought — it is built into the work order completion process and automatically feeds fleet financial KPIs.
Labor + parts + vendor charges per work order. Aggregated to cost per mile, cost per hour, and total maintenance cost per vehicle. Compare identical assets. Rising cost trajectory triggers repair-vs-replace analysis. Maintenance-to-value ratio calculated automatically for replacement timing decisions.
Track costs separately for planned PM work orders and reactive breakdown work orders. The data proves the ROI of your PM program — reactive should consistently show 3-9x higher cost per event. This comparison is the single most powerful justification for maintenance program investment.
Warranty expiration dates tracked per part and per vehicle. When a technician replaces a warranted component, the system flags it for claim submission. Systematic warranty recovery returns 3-8% of annual parts spend — money most fleets leave on the table because they lack the documentation to file claims.
Real-time budget tracking shows actual spend against plan by vehicle category, cost type, and time period. Monthly variance reporting enables course correction before annual overruns. No more end-of-year surprises where maintenance spending exceeds budget by 15-20%.
Centralized vendor profiles with pricing history, purchase frequency, and performance tracking. Compare vendor pricing before every order. Track outsourced-vs-in-house repair ratio. Monitor emergency order frequency as a cost KPI. Build the data needed for vendor negotiation leverage and sourcing decisions.
Complete, digital maintenance history per vehicle — every inspection, every work order, every PM, every parts replacement. Vehicles with documented histories command 20-30% higher resale values. Your HVI records become a financial asset at disposition time. The data pays for itself again when you sell the truck.
Frequently Asked Questions
The ATRI average is $0.202 per mile, representing 8.9% of total operating costs. Well-maintained Class 8 fleets achieve $0.12-$0.18 per mile. Construction fleets average $0.23/mile. Trucking/logistics fleets average $0.31/mile total CPM including all operating costs. Track this metric monthly per vehicle — rising CPM on a specific truck is the earliest signal of approaching replacement threshold. Book a demo to see how HVI calculates cost per mile for every vehicle in your heavy fleet.
When annual maintenance cost exceeds 40-45% of the vehicle's current fair market value. For most U.S. commercial vehicles, this occurs between years 6-8 or 400,000-600,000 miles. Include downtime cost in the calculation — a truck that costs $8,000/year in repairs but is down 45 days for those repairs costs $30,000+ in total impact. This analysis requires accurate, vehicle-specific cost data from your work orders. Start your free trial of HVI to build the vehicle-level cost data that drives repair vs replace decisions.
A 50-vehicle fleet spending $200,000 annually on maintenance can expect $60,000-$80,000 in first-year savings from reduced emergency repairs, extended component life, and optimized scheduling. A 75-truck fleet implementing structured PM reduced breakdowns by 65% and cut emergency repair costs by $127,000 in the first year. Most fleets see positive ROI within 6-14 months depending on fleet size and current practices. Book a demo to see repair cost reduction strategies for your specific fleet size.
First, track your outsourced-vs-in-house ratio. U.S. LTL carriers do 78% in-house. Truckload: 55%. Flatbed: 45%. Every repair at $125-$175/hr shop rates vs $45-$75/hr in-house is a measurable margin impact. Identify which repair types are commonly outsourced, calculate annual spend, and evaluate the ROI of building in-house capability for the highest-volume categories. See how HVI tracks outsourced vs in-house repair costs for heavy vehicle fleets.
Downtime. Industry research shows indirect expenses (downtime, admin overhead, schedule disruption, rental equipment) add 35-45% on top of direct parts and labor costs. A $400 brake repair that takes the truck off the road for 2 days costs $1,300-$1,920 in total impact ($400 repair + $900-$1,520 downtime at $448-$760/day). Most fleets do not track downtime cost at all — making their cost-per-repair data dramatically understated. Start your free trial of HVI to track total repair cost including downtime impact.
Vehicles with complete, documented maintenance histories command 20-30% higher resale values. A $50,000 truck with full digital records sells for $60,000-$65,000. Without records: $42,000-$50,000. That $10,000-$23,000 difference on a single truck demonstrates that your maintenance management system is not just a cost — it is a revenue tool at disposition. Digital records from HVI are searchable, complete, and transferable to the buyer. Book a demo to see how HVI builds resale-value-protecting maintenance documentation.
Every Untracked Repair Dollar Is a Decision Made Blind. Start Tracking Today.
Cost per vehicle. Planned vs reactive comparison. Warranty recovery. Vendor analytics. Budget variance. Repair vs replace data. Resale value documentation. One platform that turns every work order into fleet financial intelligence for your heavy vehicle operation.
No credit card • Cost tracking built into every work order • Warranty recovery included • U.S. ATRI benchmarks for comparison