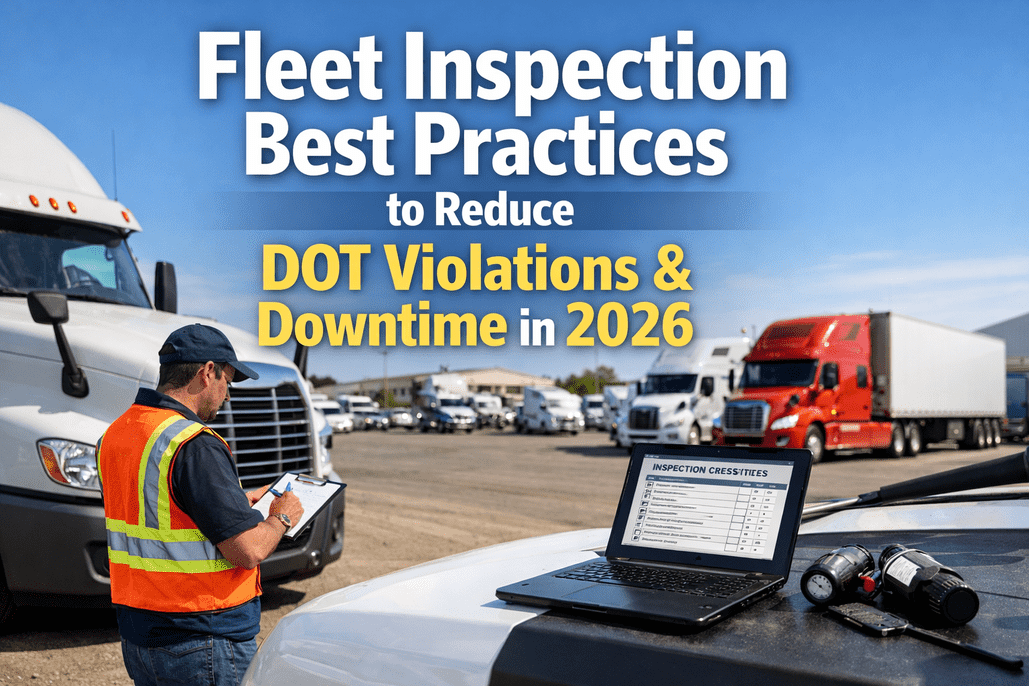
Fleet inspection programs are only as strong as their weakest link - and too often, that weakness lies in inconsistent processes, poor accountability, and reactive management. With FMCSA data showing that fleets with structured inspection programs experience 67% fewer roadside violations and 45% less unplanned downtime, the difference between best-in-class and average operations comes down to execution. This comprehensive 2026 guide covers proven strategies for building inspection culture, standardizing processes, improving driver accountability, leveraging data for decisions, and continuously improving your program. Whether you're managing 10 trucks or 1,000, HVI's digital platform provides the tools to implement these best practices fleet-wide. Schedule a demo to see how leading fleets are achieving 90%+ compliance rates.
Why Fleet Inspection Best Practices Matter in 2026
The regulatory landscape continues to tighten. FMCSA's overhauled SMS scoring now weighs recent violations more heavily, insurance carriers are demanding better documentation, and shippers increasingly require compliance proof before awarding contracts. Fleets that treat inspections as a checkbox exercise face mounting consequences - while those with systematic programs gain competitive advantages.
Fleets with structured inspection programs vs. those without formal processes
Early defect detection prevents breakdowns that cost $750+ per hour
Proactive repairs cost 3-5x less than emergency breakdowns
Documented compliance programs qualify for preferred rates
Building a Strong Inspection Culture
Technology and processes only work when people use them. The most effective fleet inspection programs start with culture - creating an environment where safety and compliance are valued, not just enforced. Without buy-in from drivers and supervisors, even the best systems become checkbox exercises.
Leadership Commitment
Culture starts at the top. When leadership treats inspections as a priority, the entire organization follows.
- Executive visibility in safety meetings and communications
- Investment in proper tools, training, and time for inspections
- Recognition programs that reward compliance, not just productivity
- Zero tolerance for pressure that compromises safety checks
Driver Engagement
Drivers are your first line of defense. Engaged drivers catch problems before they become violations or breakdowns.
- Explain the "why" - connect inspections to personal safety and job security
- Involve drivers in developing and refining inspection checklists
- Provide immediate feedback when defects are reported
- Share success stories of inspections that prevented incidents
Accountability Without Blame
Punishing defect reports kills transparency. Create systems where reporting problems is valued, not feared.
- Never discipline drivers for finding defects - discipline for hiding them
- Track defect reporting rates as a positive metric
- Address root causes of repeated defects, not just symptoms
- Make it easy to report issues without paperwork burden
Continuous Training
Initial training fades. Ongoing reinforcement keeps inspection skills sharp and adapts to new requirements.
- Annual refresher training on inspection procedures
- Targeted training when new violations emerge
- Hands-on practice, not just classroom instruction
- Updates when regulations or equipment change
Standardizing Inspection Processes
Inconsistency is the enemy of compliance. When every driver inspects differently, quality varies wildly and training becomes impossible. Standardization ensures every inspection covers required items in a logical sequence, regardless of who performs it.
Standardized Checklists
One checklist for each equipment type, used by every driver, every time. No variations, no shortcuts.
Different checklists for tractors, trailers, straight trucks, and specialized equipment - each covering items relevant to that unit type
Items ordered by physical location (walk-around sequence) not regulatory category - reduces backtracking and missed items
Specific standards for each item (e.g., "tread depth 4/32" minimum steer, 2/32" other") not vague "check tires"
Mandatory photos for high-risk items (brakes, tires, coupling) prevents pencil-whipping and provides documentation
Time Expectations
Inspections that can be "completed" in 2 minutes aren't real inspections. Set realistic time standards.
Defect Response Protocols
What happens when a defect is found? Clear protocols prevent confusion and ensure proper handling.
Safety-critical (OOS), safety-related (repair within 24hrs), or minor (schedule repair)
Photo, description, location on vehicle, when discovered, driver name
OOS: dispatch + maintenance immediately. Other: maintenance within shift
OOS: do not operate until repaired. Other: operate with documented plan
Next driver confirms repair before operation, signs acknowledgment
Implement Best Practices Fleet-Wide
HVI's digital platform provides standardized checklists, automated defect routing, and compliance tracking that makes best practices the default. See how leading fleets achieve 90%+ inspection compliance rates.
Improving Driver Accountability
Accountability requires visibility. You can't manage what you can't measure. Digital inspection systems provide the transparency needed to recognize good performers, coach those struggling, and identify patterns that indicate problems.
Key Metrics to Track
- Completion Rate: % of required inspections actually completed
- On-Time Rate: % completed within required timeframe
- Defect Reporting Rate: Defects found per inspection (too low = not inspecting, too high = equipment issues)
- Inspection Duration: Time spent per inspection (too short = rushing)
- Photo Compliance: % with required photos captured
- Roadside Correlation: Drivers' inspection findings vs. roadside results
Recognition & Rewards
- Monthly Leaders: Recognize top performers by completion rate and defect detection
- Clean Inspection Bonuses: Reward drivers who pass roadside inspections without violations
- Defect Detection Awards: Bonus for catching significant issues before they cause problems
- Team Competitions: Terminal or shift competitions drive peer accountability
- Career Recognition: Include compliance record in promotion decisions
Coaching Opportunities
- Sub-5 Minute Inspections: Ride-along to observe actual inspection habits
- Zero Defects Long-Term: Review for thorough inspection technique
- Repeated Same Defects: Training on specific component inspection
- Roadside Failures: Post-inspection review - what was missed and why
- Photo Quality Issues: Training on what documentation is needed
Progressive Discipline
- First Occurrence: Coaching and documentation of expectations
- Second Occurrence: Written warning with improvement plan
- Third Occurrence: Final warning with specific consequences
- Continued Non-Compliance: Termination - safety is non-negotiable
- Falsification: Immediate termination - zero tolerance
Using Inspection Data for Decisions
Every inspection generates data. Analyzed properly, this data reveals patterns that drive better decisions about equipment, training, scheduling, and resource allocation. Fleets that leverage inspection analytics outperform those that just collect records.
Equipment Insights
Which vehicles generate the most defects? Are certain units chronic problems that should be replaced?
Are brakes, tires, or lights your biggest issue? Direct PM resources to highest-impact areas.
When do defect rates increase? Data-driven replacement timing vs. arbitrary schedules.
Are certain equipment brands more reliable? Inform future purchasing decisions.
Operational Insights
Are early morning inspections less thorough? Adjust schedules or supervision.
Do certain terminals have higher defect rates? Identify training or equipment gaps.
Do certain routes cause more equipment wear? Adjust PM schedules for high-wear routes.
Winter lighting issues? Summer tire problems? Proactive seasonal preparation.
Compliance Insights
How do internal inspection findings correlate with roadside results? Identify blind spots.
What percentage of required documentation is complete? Proactive gap identification.
Do defect detection rates improve after training? Measure training ROI.
How does your fleet compare to industry averages? Set improvement targets.
Key Dashboard Metrics for Fleet Managers
Continuous Improvement Strategies
Best practices evolve. Regulations change, technology improves, and your fleet's needs shift. Building continuous improvement into your inspection program ensures you stay ahead rather than falling behind.
Regular Program Reviews
Schedule quarterly reviews of your inspection program effectiveness. Include:
- Compliance rate trends - improving or declining?
- Defect category analysis - what's getting better, what's not?
- Roadside inspection correlation - are internal inspections catching what officers find?
- Driver feedback - what's working, what's frustrating?
- Technology gaps - what manual processes could be automated?
Post-Incident Analysis
Every roadside violation, breakdown, or accident is a learning opportunity:
- Was there a pre-trip inspection that day? What did it find?
- Could the issue have been detected during inspection?
- Is the checklist missing items that would catch this?
- Was the driver trained to identify this type of defect?
- What process changes would prevent recurrence?
Regulatory Monitoring
Stay ahead of regulatory changes that affect inspection requirements:
- FMCSA regulatory updates and guidance documents
- State-specific requirement changes
- CSA scoring methodology updates
- ELD and inspection integration requirements
- Industry association alerts and best practice updates
Technology Adoption
Evaluate new technologies that can improve inspection quality and efficiency:
- AI-powered defect detection and photo analysis
- Predictive maintenance integration
- Real-time compliance monitoring dashboards
- Automated regulatory update integration
- Advanced analytics and benchmarking tools
Ready to Implement Fleet Inspection Best Practices?
HVI's digital platform provides the foundation for best-in-class inspection programs - standardized checklists, automated workflows, driver accountability tracking, and analytics dashboards that turn data into action.