The purchase price sticker is not the cost. Total cost of ownership reveals the true financial comparison — and for an increasing number of heavy vehicle duty cycles, electric wins. Electricity costs $0.03-$0.06 per mile vs $0.15-$0.25 for diesel — a 60-80% fuel cost reduction that compounds over 100,000+ miles per year. Maintenance costs drop 30-50% because EVs have roughly 20 moving drivetrain parts vs 2,000+ in a diesel engine — no oil changes, no transmission service, no exhaust aftertreatment, and regenerative braking dramatically reduces brake wear. Federal tax credits provide up to $40,000 per commercial truck under the Inflation Reduction Act. State programs like California HVIP add up to $60,000 per vehicle. Combined incentives can reduce total electrification costs by 20-40%. A fleet running regional haul at 100,000 miles per year saves approximately $30,000 per truck annually in fuel and maintenance alone ($0.70/mile diesel vs $0.40/mile electric). With incentives reducing the purchase premium, payback periods of 4-6 years — and as short as 2-3 years for high-mileage urban/regional routes — are documented. But TCO is only half the equation. Managing the vehicles after purchase — inspections, maintenance, battery health tracking, compliance documentation — is where the ongoing savings materialize or evaporate. A fleet that buys EVs but manages them with diesel-era tools loses the operational advantages that make the TCO case work. This guide walks through every cost category, provides the calculation framework, identifies hidden costs most calculators miss, and shows how HVI tracks the real-world data that proves whether your EV investment is delivering. Book a demo to see HVI's EV fleet TCO tracking, or start your free trial.
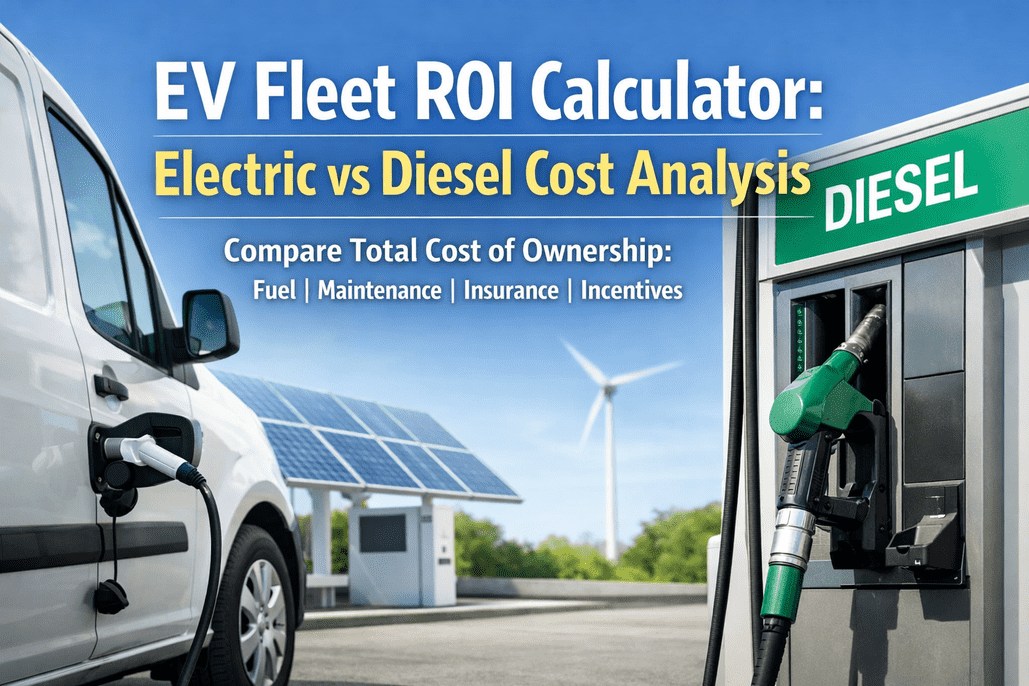
Calculate EV fleet ROI with real data. Compare electric vs diesel total cost of ownership including fuel, maintenance, insurance, incentives, and the hidden costs most calculators miss.
The 7 Cost Categories That Determine EV Fleet ROI
Most ROI calculators only compare fuel and purchase price. A real TCO analysis must include all seven cost categories. The categories where EVs win are larger than the categories where diesel wins — which is why TCO favors electrification for most commercial duty cycles.
Electricity: $0.03-$0.06/mile. Diesel: $0.15-$0.25/mile. 60-80% reduction. At 100K miles/year, savings of $12,000-$20,000 per truck annually. Off-peak charging (11pm-6am) can cut electricity cost by 50% vs peak rates. Smart charging is a fleet management function, not just an infrastructure decision.
EVs: $0.04/mile. Diesel: $0.08-$0.12/mile. 30-50% reduction. No oil changes, no transmission service, no exhaust aftertreatment (DPF/SCR), dramatically reduced brake wear (regen braking). Remaining EV maintenance: tires, cabin filters, coolant system, battery module balancing, inverter inspection.
Federal: up to $40,000 per commercial truck (IRA). California HVIP: up to $60,000 per qualifying HD vehicle. Infrastructure grants: 30-80% of charging installation costs. Combined incentives reduce total electrification costs by 20-40%. Status of federal credits may change under current administration — state programs generally more stable.
EVs cost $10K-$30K more for medium-duty, $50K-$100K+ more for Class 8. This premium is the primary barrier. However, battery costs have dropped 89% since 2008 and purchase parity is projected by 2030-2035 for most vehicle classes. When combined with incentives, the effective premium narrows dramatically.
EV insurance runs ~28% higher ($180/mo vs $140/mo) due to higher replacement cost and specialized repair labor. However, lower accident rates from advanced driver-assist systems and fleet telematics can offset premiums. Some insurers now offer EV-specific fleet policies with more favorable rates.
EV resale values are stabilizing as the used market matures. Battery SOH documentation from fleet management systems helps preserve resale value by proving vehicle condition. After 5 years, EV trucks show approximately 53% residual value — comparable to diesel. Battery condition is the key variable.
Level 2 charging: $2,000-$8,000 per unit. DC fast charging: $30,000-$150,000+. Battery energy storage: $300-$500/kWh. Grid upgrades may add $50K-$500K+ depending on utility capacity. These costs are amortized across the fleet and across the infrastructure's 10-15 year life — but they must be included in year-one cash flow planning.
The ROI Calculation Framework
(Annual miles ÷ MPG × diesel price) + maintenance/mile + insurance + depreciation. Example: 100K miles, 6 MPG, $4.00/gal diesel = $66,700 fuel + $10,000 maintenance + $1,680 insurance + $12,000 depreciation = $90,380/year
(Annual miles ÷ mi/kWh × electricity rate) + maintenance/mile + insurance + depreciation + charging infrastructure amortized. Example: 100K miles, 2.0 kWh/mile, $0.12/kWh = $24,000 energy + $4,000 maintenance + $2,160 insurance + $15,000 depreciation + $3,000 infra = $48,160/year
Diesel cost (A) minus EV cost (B) = $90,380 - $48,160 = $42,220/year savings per truck. Over 5-year ownership: $211,100 cumulative savings per truck. For a 25-truck fleet: $1,055,500 over 5 years — before incentives.
Net purchase premium (EV price - diesel price - incentives) ÷ annual savings = payback. Example: $180K EV - $120K diesel - $40K incentives = $20K net premium. $20K ÷ $42,220 = 5.7 months payback. Even without incentives: $60K ÷ $42,220 = 1.4 years.
Hidden Costs Most Calculators Miss
Utility demand charges are based on peak power draw — not total energy consumed. Charging an entire fleet simultaneously at shift end can trigger demand charges exceeding the electricity cost itself. In some cases, demand charges account for over 70% of monthly electricity bills. Smart charging software that staggers overnight charging can reduce this by 50%+.
Technicians working on electric heavy vehicles need NFPA 70E high-voltage certification. Training costs $2,000-$5,000 per technician. Class 0 insulating gloves require 6-month testing cycles per ASTM D120. LOTO equipment and procedures must be established. These costs are real but amortized across the EV fleet and across years of service.
Charging time is currently slower than diesel fueling. If your duty cycle requires vehicles available for 20+ hours/day, charging windows become a constraint. This may require additional vehicles (5-10% fleet oversizing) or operational schedule adjustments. Factor this into your fleet planning — not as a reason to avoid EVs, but as an operational variable to manage.
Batteries degrade over 3,000-5,000 charge cycles. Most warranties cover 70-80% capacity retention for 8 years/100K+ miles. But if you plan to own beyond warranty, budget a "sinking fund" for potential battery refurbishment ($8,000-$20,000+). Track SOH per vehicle from day one — this data is essential for replacement planning and resale value.
Managing diesel and EV vehicles requires different inspection checklists, different PM schedules, different technician certifications. If your fleet software cannot handle both powertrains on one platform, you are running two parallel systems — doubling admin overhead and creating compliance gaps. The software cost is a line item; the operational cost of not having it is much larger.
EV resale value depends heavily on battery SOH documentation. A truck with 80% SOH and complete charging/maintenance records sells for significantly more than the same truck without data. Your fleet management system must track battery health, charge cycles, and maintenance history from day one — this data directly impacts residual value.
Payback Period by Vehicle Class
Payback: 2-4 years
Annual savings: $8,000-$15,000/truck
Best for: Urban delivery, utility, last-mile
Shortest payback. High-mileage, return-to-base routes with predictable daily range. Overnight depot charging at off-peak rates. Strongest incentive availability. Many models commercially available (eCanter, Lightning eMotors, BrightDrop).
Payback: 3-5 years
Annual savings: $15,000-$25,000/truck
Best for: Regional distribution, refuse, transit
Strong TCO case for regional routes under 200 miles/day. Refuse haulers benefit enormously from regenerative braking in stop-and-go operation. Transit buses are among the most proven EV heavy vehicle applications.
Payback: 4-6 years
Annual savings: $25,000-$40,000/truck
Best for: Drayage, regional haul, dedicated corridors
Highest absolute savings per truck. Purchase premium is largest ($50K-$100K+) but so is fuel/maintenance delta. eCascadia, VNR Electric, Tesla Semi proving viability. Long-haul sleeper applications still challenging — range and charging time limitations.
How HVI Tracks Real-World EV ROI
Calculators estimate ROI before purchase. HVI tracks actual ROI after deployment — proving whether the business case is materializing with your real operational data.
Side-by-side actual cost per mile by powertrain: energy/fuel, maintenance, parts, labor. Updated in real time from inspection and work order data. Compare identical routes run by diesel and EV trucks — not theoretical projections, but your actual numbers.
State of Health tracked over time with degradation curves. Configurable alerts at threshold levels (90%, 80%, 75%). Replacement cost forecasting based on actual degradation rate. Charge cycle counting. Essential for residual value documentation and warranty claims.
Diesel and electric on one dashboard. Auto-loads correct inspection template per powertrain. Separate PM schedules running simultaneously. Unified cost tracking that produces the actual TCO comparison across your fleet — proving which powertrain wins for which duty cycle.
NFPA 70E technician certifications. ASTM D120 glove testing cycles. LOTO documentation. Arc flash assessments. Only HV-certified technicians assigned to EV work orders. These compliance costs are part of your EV TCO — and must be tracked to calculate true cost-per-mile.
Frequently Asked Questions
2-4 years for Class 4-5 medium-duty (delivery, utility). 3-5 years for Class 6-7 (regional distribution, refuse). 4-6 years for Class 8 (drayage, regional haul). Payback accelerates with higher annual mileage, lower electricity rates, and stronger incentive programs. With full federal + state incentives, some duty cycles achieve payback under 2 years. Book a demo for a personalized TCO analysis using your fleet data.
30-50% lower maintenance costs vs diesel. EVs have ~20 drivetrain parts vs 2,000+ in a diesel engine. No oil changes, no transmission service, no DPF/SCR aftertreatment, and regenerative braking extends brake pad life 2-3x. Remaining EV maintenance: tires, cabin filters, coolant system, battery balancing, inverter checks. HVI tracks actual maintenance cost per mile for both powertrains side-by-side. See it in a demo.
The Inflation Reduction Act provides up to $40,000 per qualifying commercial truck. However, the current administration has proposed changes that may affect future availability. State programs (California HVIP up to $60K, Colorado, New York, Oregon) generally remain more stable. The business case increasingly stands on TCO merit alone — incentives accelerate payback but are not required for positive ROI on many duty cycles. Book a demo to see TCO with and without incentives.
Use a fleet management platform that tracks actual cost-per-mile by powertrain: energy consumption, maintenance events, parts costs, labor hours, battery health, and downtime. HVI provides side-by-side diesel vs EV cost dashboards using your operational data — not projections. This proves whether the business case is materializing and identifies which routes/duty cycles deliver the strongest returns. Start your free trial to begin tracking.
Battery replacement ($8K-$20K+ for medium-duty, $150K+ for Class 8) is rarely needed within typical fleet ownership periods. Most manufacturers warranty 8 years/100K+ miles at 70-80% capacity retention. Budget a sinking fund if holding beyond warranty. Track battery SOH per vehicle from day one — degradation rate data is essential for replacement timing and resale value. HVI tracks SOH with configurable alerts. See battery tracking in a demo.
Yes — this is a core capability. HVI auto-loads correct inspection templates per powertrain, runs separate PM schedules, tracks energy/fuel costs per vehicle, monitors battery SOH for EVs, and produces unified TCO comparisons across your entire fleet. One dashboard shows which trucks cost more to operate — diesel or electric — based on your actual data. Book a demo to see mixed fleet cost tracking in action.
Track actual diesel vs EV cost-per-mile from your own fleet data. Battery SOH monitoring. Mixed fleet management on one platform. Know which trucks are saving money — and which are not — based on real numbers, not projections.
No credit card • No hardware • Diesel + EV on one platform