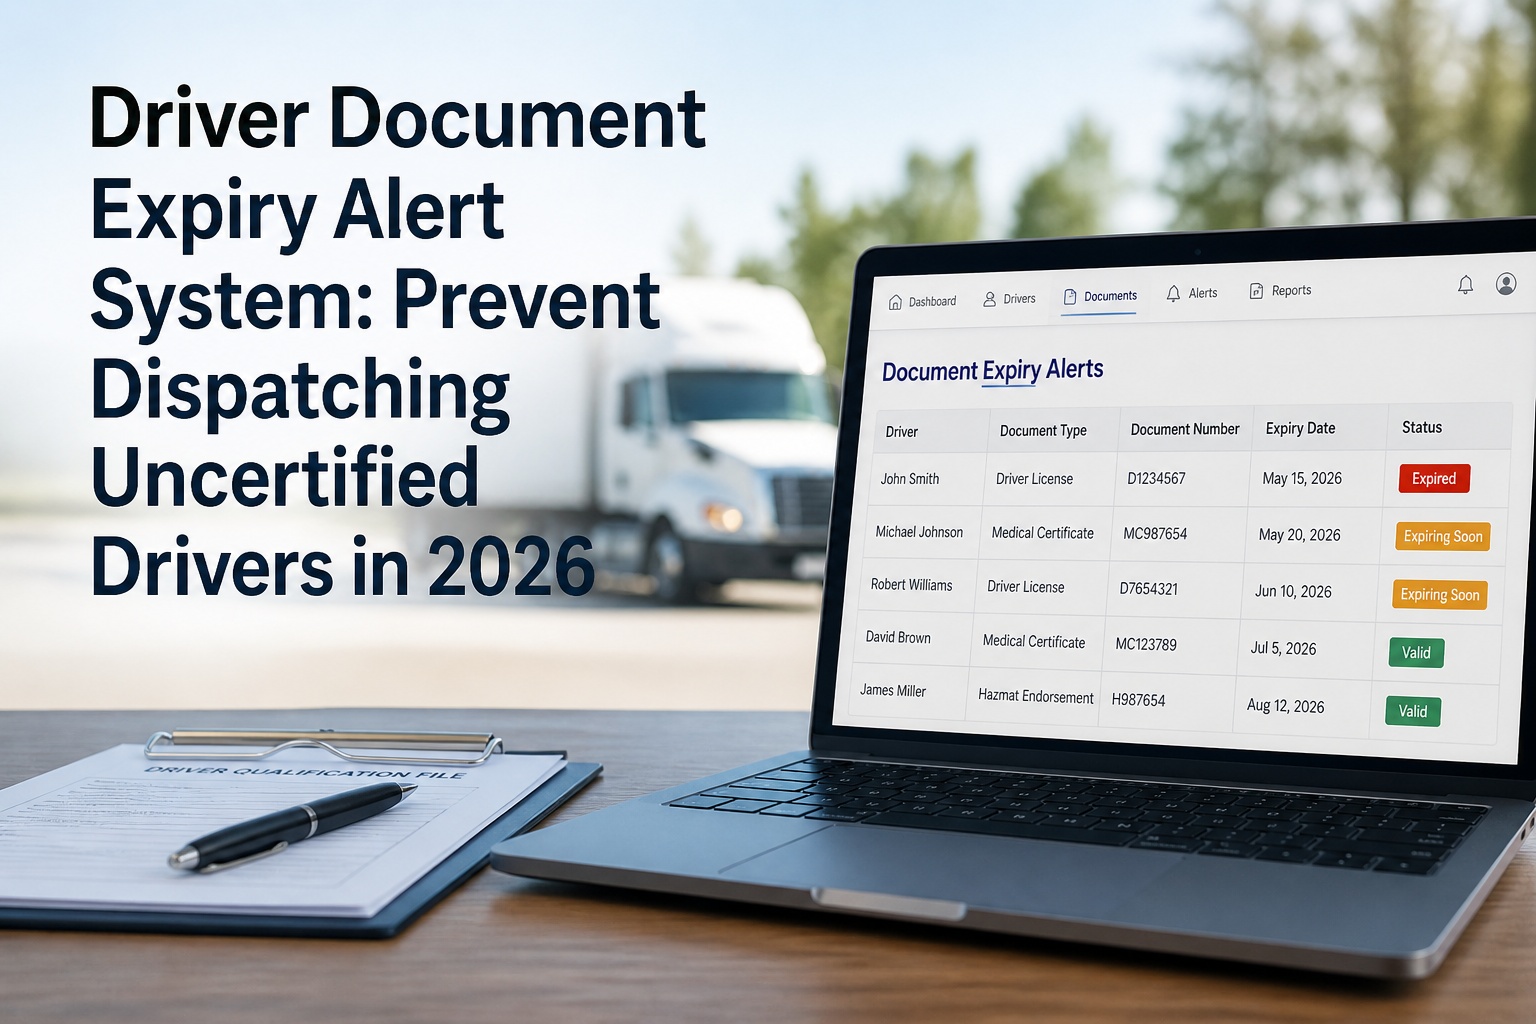
A single speeding ticket can add 10 points to your CSA score. A brake violation at a roadside inspection? Up to 8 points—multiplied by 3 if it happened in the last 6 months. These violation points don't just sit on a report; they directly impact your fleet's insurance premiums, audit likelihood, customer relationships, and bottom line. The FMCSA's Compliance, Safety, Accountability (CSA) program uses the Safety Measurement System (SMS) to rank carriers against their peers, identifying those with safety problems for intervention. Understanding how DOT violation points work—and how they accumulate into CSA scores—is essential for protecting your fleet from warning letters, compliance reviews, and out-of-service orders. This guide explains the CSA scoring system, how violations affect your fleet, and proven strategies to reduce your scores through proactive inspections. Sign up for HVI to catch violations before inspectors do, or book a demo to see how digital inspections improve CSA scores.
What Are DOT Violation Points?
DOT violation points are numerical values assigned to safety violations discovered during roadside inspections, compliance reviews, and crash investigations. These points feed into the FMCSA's Safety Measurement System (SMS), which calculates your carrier's CSA scores and determines whether you'll be prioritized for enforcement intervention.
The DOT Violation Points System
Every safety violation discovered by law enforcement is assigned a severity weight reflecting its relationship to crash risk. These points are then multiplied by a time weight based on recency, and grouped into one of seven safety categories called BASICs (Behavior Analysis and Safety Improvement Categories). Your carrier is then ranked against similar carriers to produce a percentile score in each category.
CSA Score Calculation Formula
Key Points About DOT Violation Points
Violations are assigned to the motor carrier's DOT number, not individual drivers. However, driver violations directly impact carrier scores.
A violation from last month has 3x the impact of the same violation from 18 months ago due to time weighting.
Your score is a percentile (0-100) comparing you to similar carriers. Higher percentile = worse performance.
SMS data is updated monthly with new inspection results, so scores can change frequently.
Simplified Severity Weights Coming
FMCSA is overhauling the SMS methodology with significant changes:
- Simplified severity scale: The 1-10 scale will become 1-2 (OOS violations = 2, all others = 1)
- Consolidated violations: 2,000+ violation codes grouped into ~100 violation groups
- Renamed categories: "BASICs" becoming "Compliance Categories"
- Restructured categories: Controlled Substances/Alcohol merged into Unsafe Driving; Vehicle Maintenance split into two categories
Until the updated system launches, carriers should continue monitoring scores under the current methodology while preparing for the changes.
CSA Score Categories Explained
The FMCSA evaluates carrier safety across seven Behavior Analysis and Safety Improvement Categories (BASICs). Each category focuses on a specific type of safety concern, and carriers receive separate percentile scores in each. Understanding these categories helps you identify where your fleet is most vulnerable and prioritize improvement efforts.
Unsafe Driving
Threshold: 65%Operation of commercial motor vehicles in a dangerous or careless manner, including moving violations observed during inspections or reported by law enforcement.
- Speeding (4-10 points based on severity)
- Reckless driving (10 points)
- Improper lane change (5 points)
- Texting while driving (10 points)
- Failure to wear seatbelt (7 points)
- Following too closely (5 points)
Hours of Service (HOS) Compliance
Threshold: 65%Violations of driving time limits, required rest periods, logbook requirements, and ELD compliance. This is one of the most common violation categories.
- Driving beyond 11-hour limit (7 points)
- Driving beyond 14-hour window (7 points)
- False record of duty status (7 points)
- No ELD or non-compliant device (5 points)
- Driving after HOS violation (10 points)
- Incomplete logbook (1-4 points)
Vehicle Maintenance
Threshold: 80%Failure to properly maintain commercial motor vehicles, including defects discovered during inspections. This is the highest-volume violation category.
- Brakes out of service (8 points)
- Inoperable required lamp (4 points)
- No proof of periodic inspection (4 points)
- Tire tread depth below minimum (8 points)
- Brake hose chafing/kinking (4 points)
- Oil/grease leak (1 point)
Controlled Substances/Alcohol
Threshold: 80%Operation of CMVs while impaired by alcohol, illegal drugs, or misuse of prescription/OTC medications. Violations in this category carry severe consequences.
- Operating under influence (10 points)
- Possession of controlled substance (10 points)
- Alcohol in CMV (10 points)
- Positive drug/alcohol test (10 points)
- Refusal to submit to testing (10 points)
Driver Fitness
Threshold: 80%Operation of CMVs by drivers who are unfit due to lack of training, experience, medical qualification, or licensing issues.
- No valid CDL (8 points)
- Driving while disqualified (10 points)
- No valid medical certificate (5 points)
- Wrong CDL class/endorsement (8 points)
- Suspended CDL (10 points)
- Operating without English proficiency (2 points)
Hazardous Materials Compliance
Threshold: 80%Unsafe handling, marking, placarding, or transportation of hazardous materials. Only applies to carriers transporting hazmat requiring placards.
- Failure to placard (4-7 points)
- Leaking containers (4 points)
- Improper package markings (4 points)
- No shipping papers (4 points)
- Smoking near hazmat (7 points)
Crash Indicator
Threshold: 65%Patterns of crash involvement based on state-reported crashes meeting reportable criteria (fatality, injury requiring medical attention away from scene, or vehicle towed).
- Crash frequency and severity
- Time since crashes occurred
- Fleet size and mileage exposure
- Crash preventability (CPDP)
Note: This BASIC is not publicly visible—only carriers and enforcement can see it.
Intervention Thresholds
When your percentile score reaches or exceeds these thresholds, FMCSA may prioritize you for investigation or other intervention:
Passenger carriers and hazmat carriers have lower thresholds (50-75% depending on category).
Understanding your current BASIC scores is the first step to improvement. Sign up for HVI to implement proactive inspections that target your highest-risk categories, or schedule a consultation to develop a score improvement strategy.
How DOT Violations Affect Fleets
High CSA scores create a cascade of negative consequences that extend far beyond the initial violation. Understanding these impacts helps justify investment in prevention and compliance programs.
Increased FMCSA Intervention
High scores trigger escalating enforcement actions from FMCSA, consuming time and resources while putting your operating authority at risk.
Higher Insurance Premiums
Insurance underwriters use CSA scores to assess risk. High scores directly translate to higher premiums—or difficulty obtaining coverage at all.
Insurers view high CSA scores as predictive of future claims. Even modest score increases can result in premium hikes of 10-30% or more at renewal.
Lost Business Opportunities
Shippers, brokers, and 3PLs increasingly check CSA scores when selecting carriers. Five of the seven BASICs are publicly visible to anyone.
- Shippers may refuse to work with high-score carriers
- Brokers screen carriers before load assignments
- Amazon Relay and similar programs flag high-risk carriers
- Contract opportunities may require score thresholds
- Reputation damage affects long-term relationships
Driver Recruitment Challenges
Quality drivers research potential employers—and high CSA scores signal problems. Carriers with poor scores struggle to attract and retain safe, experienced drivers.
- Experienced drivers avoid high-risk carriers
- Increased audit scrutiny creates stressful work environment
- Higher insurance costs may affect driver benefits
- Good loads go to compliant carriers, leaving less desirable freight
The True Cost of Poor CSA Scores
The cost of prevention is always less than the cost of violation. Start your free HVI trial to implement daily inspections that catch defects before roadside enforcement finds them, or book a demo to see how leading fleets protect their CSA scores.
Common High-Risk Violations
Some violations carry significantly more weight than others—both in terms of CSA points and enforcement consequences. Knowing which violations to prioritize helps you focus prevention efforts where they matter most.
High-Severity Violations (8-10 Points)
| Violation | Category | Points | OOS Rate |
|---|---|---|---|
| Texting while operating CMV | Unsafe Driving | 10 | High |
| Speeding 15+ mph over limit | Unsafe Driving | 10 | High |
| Reckless driving | Unsafe Driving | 10 | High |
| Operating under influence | Controlled Substances | 10 | 100% |
| Driving while disqualified | Driver Fitness | 10 | 100% |
| Driving after HOS violation | HOS Compliance | 10 | 100% |
| Brakes out of service (20%+) | Vehicle Maintenance | 8 | 99.9% |
| No valid CDL | Driver Fitness | 8 | 100% |
| Tire flat/audible air leak | Vehicle Maintenance | 8 | 97.8% |
Most Frequently Cited Violations
These violations occur most often during roadside inspections—making them priority areas for prevention:
The #1 vehicle maintenance violation. Headlights, taillights, brake lights, turn signals, and marker lamps must all function.
4 points • Easy to preventOperating without valid annual DOT inspection documentation. The #2 vehicle maintenance violation—133,000+ citations annually.
4 points • 12 CSA points total with time weightClamp or roto-type brakes out of adjustment. Often caught even with automatic slack adjusters.
4-8 points • High OOS rateThe most common Unsafe Driving violation. Traffic stops often trigger Level 3 inspections.
4 points • Triggers additional scrutinyIncomplete logbook entries, missing supporting documents, or ELD malfunction without backup.
1-7 points • Very commonBelow 4/32" on steer axle or 2/32" on drive/trailer axles results in violation.
8 points • High OOS rateOut-of-Service Violations: The Worst Offenders
These violations result in immediate out-of-service orders, meaning the vehicle or driver cannot operate until the defect is corrected:
Reducing CSA Scores with Inspections
The most effective way to improve CSA scores is to prevent violations before they happen. Consistent, thorough inspections—both daily pre-trips and internal audits—catch defects before roadside enforcement finds them. Here's how to build an inspection program that protects your scores:
Implement Digital Pre-Trip Inspections
Paper inspections are prone to "pencil whipping"—drivers checking boxes without actually inspecting. Digital inspections with guided workflows and photo requirements ensure thorough, documented inspections every time.
- Guided checklists ensure no items are missed
- Photo documentation proves actual inspection occurred
- GPS and timestamps prevent falsification
- Defects automatically trigger work orders
- Creates audit-ready documentation
Prioritize High-Point Violations
Focus maintenance and inspection efforts on the components that cause the most CSA damage: brakes, tires, and lights account for over 60% of vehicle OOS violations.
- Brake adjustment and air system integrity
- Tire tread depth, pressure, and condition
- All lighting devices (check every trip)
- Coupling devices and fifth wheel
- Steering and suspension components
Conduct Regular Internal Audits
Quarterly mock inspections using CVSA criteria identify issues before roadside enforcement does. Document findings and corrective actions to demonstrate proactive compliance.
- Use CVSA Level 1 inspection criteria
- Document all findings (even clean results)
- Track patterns across fleet
- Correct deficiencies before vehicles operate
- Review trends monthly
Train Drivers on CSA Impact
Drivers who understand how their actions affect CSA scores are more likely to take inspections seriously and avoid risky behaviors. Make CSA awareness part of ongoing training.
- How violations affect carrier scores
- High-point violations to avoid
- Proper pre-trip inspection techniques
- Professional interaction with inspectors
- HOS compliance and ELD usage
Use DataQs to Contest Errors
Not all violations are valid. The FMCSA's DataQs system allows you to challenge incorrect violations with proper documentation. Successfully contested violations are removed from your score.
- Violation was issued in error
- Court dismissed the citation
- Crash was not preventable (CPDP)
- Documentation proves compliance
- Vehicle was not under your authority
Hire with PSP Screening
The FMCSA Pre-Employment Screening Program (PSP) shows driver crash and inspection history for the past 5 years. Hiring drivers with clean records protects your scores from the start.
- 8% lower crash rates for fleets using PSP
- 17% lower driver OOS rates
- Identify patterns before hiring
- Protect scores from high-risk drivers
- $10 per report—worth the investment
How Long Does It Take to Improve CSA Scores?
CSA scores naturally improve over time as violations age out—but you can accelerate improvement with proactive measures:
Recent violations have maximum impact (3x weight). Focus on preventing new violations. Clean inspections begin building positive data.
Violations from 6+ months ago drop to 2x weight. Consistent clean inspections show improvement trend.
Violations now at 1x weight. Accumulated clean inspections significantly improve percentile ranking.
Old violations drop off entirely. With consistent compliance, scores reflect current (improved) performance.
Frequently Asked Questions
Protect Your CSA Scores with Proactive Inspections
Every violation avoided is points saved. HVI's digital inspection platform helps your drivers complete thorough pre-trip inspections that catch defects before roadside enforcement does—keeping your fleet compliant, your CSA scores clean, and your business protected.
No credit card required • CSA-focused inspection templates included • Setup in under 10 minutes