A transportation company discovered their $340,000 problem at 2:47 AM when a tractor-trailer's brake failure caused a multi-vehicle accident. The driver had marked "brakes inspected—OK" on 47 consecutive daily vehicle inspection reports (DVIRs) without ever checking brake pad thickness. Investigators found 2mm pads (replacement required at 4mm) and air brake lines with visible cracks. The accident cost $127,000 in vehicle damage, $183,000 in liability settlements, $30,000 in FMCSA penalties for inspection fraud, plus terminated insurance coverage. The driver admitted he completed DVIRs in 90 seconds each morning by checking every box "OK" without performing actual inspections—a practice called "pencil-whipping." Across their 85-truck fleet, management discovered 67% of drivers engaged in similar inspection fraud, creating catastrophic risk they never knew existed. This wasn't a driver problem—it was a system problem that paper DVIRs make inevitable.
The Economics of Inspection Fraud
Quantifying the financial impact of pencil-whipping
68%
drivers admit
Percentage of commercial drivers who admit to pencil-whipping inspections at least occasionally
$340K
avg accident cost
Average cost of preventable accidents caused by missed inspection defects
94%
defects missed
Critical safety defects that go undetected when inspections are pencil-whipped
47 sec
fraud time
Average time to pencil-whip a complete DVIR vs. 12-18 minutes for honest inspection
Pencil-whipping isn't malicious—it's predictable human behavior when inspection systems lack accountability. Paper DVIRs create three fatal conditions: no verification that inspections actually occurred, no consequences for fraudulent completion, and time pressure that rewards shortcuts. The result: systematic inspection fraud that destroys safety programs, multiplies accident risk, and creates massive liability exposure. Understanding the true cost of pencil-whipping reveals why digital inspection systems aren't optional—they're essential for fleet survival.
The True Cost of Pencil-Whipping
Inspection fraud creates cascading costs that far exceed the immediate safety risks. These expenses accumulate across five categories.
Annual Cost Impact: 50-Truck Fleet
Comprehensive financial analysis of pencil-whipping consequences
Preventable Accidents
$680,000
Accident frequency increase:
2.8x higher with pencil-whipping vs. verified inspections
Missed defect accidents:
2 preventable accidents/year (brake, tire, light failures)
Average accident cost:
$340K (vehicle damage, liability, medical, downtime)
Legal & Regulatory Penalties
$245,000
FMCSA inspection violations:
$8,500/violation × 8 violations = $68,000
Liability settlements (fraudulent records):
$150,000 additional exposure per accident with falsified DVIRs
Legal defense costs:
$27,000 defending negligent inspection practices
Accelerated Equipment Failure
$156,000
Undetected minor issues become major repairs:
$800 fluid leak → $12,000 engine replacement
Component life reduction:
28% shorter lifespan when issues caught late vs. early
Emergency repair premium:
65% higher cost for roadside vs. preventive shop repairs
Insurance Premium Increases
$94,000
Claims frequency impact:
Each preventable claim increases annual premium 18-25%
Coverage reduction:
Carriers exclude coverage for "known defects" if DVIRs fraudulent
Experience modification rate:
3-year penalty period with 30-45% premium increases
Operational Downtime
$127,000
Unplanned breakdowns:
340 additional hours/year from missed early warning signs
Revenue loss per breakdown hour:
$285/hour (missed deliveries, customer penalties, expedited freight)
Replacement vehicle costs:
$30,000 annual rental/replacement during unplanned repairs
Total Annual Cost of Pencil-Whipping
$1,302,000
50-truck fleet • $26,040 per vehicle per year
These costs compound: each preventable accident triggers insurance increases that persist for 3 years, while systematic inspection fraud creates nuclear verdict exposure when plaintiff attorneys discover falsified DVIRs. The financial risk isn't theoretical—it's happening now in fleets relying on paper inspections. Start your free trial to see how digital inspections eliminate pencil-whipping.
Stop Losing $26,040 Per Vehicle to Inspection Fraud
Digital inspections with photo requirements, GPS verification, and mandatory completion make pencil-whipping impossible. See exactly how honest inspections protect your fleet.
Why Pencil-Whipping Happens: Root Causes
Understanding why drivers and technicians fake inspections reveals why the problem requires system-level solutions rather than discipline-focused approaches.
Six Factors That Enable Inspection Fraud
Systemic issues that make pencil-whipping inevitable with paper DVIRs
1
Zero Accountability
The Problem: Paper DVIRs cannot verify inspections actually occurred. Anyone can check all boxes in 47 seconds with no proof required.
Real Example: Driver checked "tires inspected—OK" daily for 3 weeks. Tire blew out at highway speed due to visible sidewall damage present for 10+ days. No way to prove inspection was faked until accident investigation.
2
Time Pressure
The Problem: Drivers face dispatch pressure to depart on schedule. Thorough 12-18 minute inspections delay departures; pencil-whipping takes 47 seconds.
Real Example: Fleet averages 6:00 AM departures. Drivers arriving at 5:55 AM choose pencil-whipping over honest inspection that delays profitable load. Dispatcher never asks why DVIRs always show zero defects.
3
No Consequences
The Problem: Management can't detect pencil-whipping until accidents occur. Without consequences, behavior continues unchecked across entire fleet.
Real Example: Management reviews DVIRs quarterly. All show 100% inspection completion with 2-5% defect rate (industry average: 18-25%). No one questions suspiciously low defect discovery until FMCSA audit reveals fraud.
4
Reporting Punishment
The Problem: Drivers who report defects face vehicle swaps, delays, or dispatcher frustration. Easier to report no defects than deal with consequences of honest reporting.
Real Example: Driver reports "ABS light intermittent" requiring shop diagnosis. Dispatcher assigns different truck, causing 90-minute delay. Next week, same driver reports zero defects despite obvious wiper damage. Pencil-whipping becomes survival strategy.
5
Inspection Ignorance
The Problem: Many drivers lack training to identify defects. Rather than admit ignorance, they check all boxes "OK" assuming no obvious problems means vehicle is safe.
Real Example: Driver sees "low coolant" warning light, adds coolant, marks "cooling system—OK" on DVIR. Never checks for leak source. Three days later, water pump fails catastrophically. Driver genuinely didn't know warning light indicated problem requiring mechanic inspection.
6
Cultural Acceptance
The Problem: When senior drivers openly pencil-whip inspections, new drivers adopt the practice. Dishonest inspections become normalized fleet culture.
Real Example: New driver spends 15 minutes on first-day inspection, discovers brake adjustment needed. Veteran driver says "You'll never make pickup on time doing real inspections—just mark it OK like everyone else." Within two weeks, new driver pencil-whips like the rest.
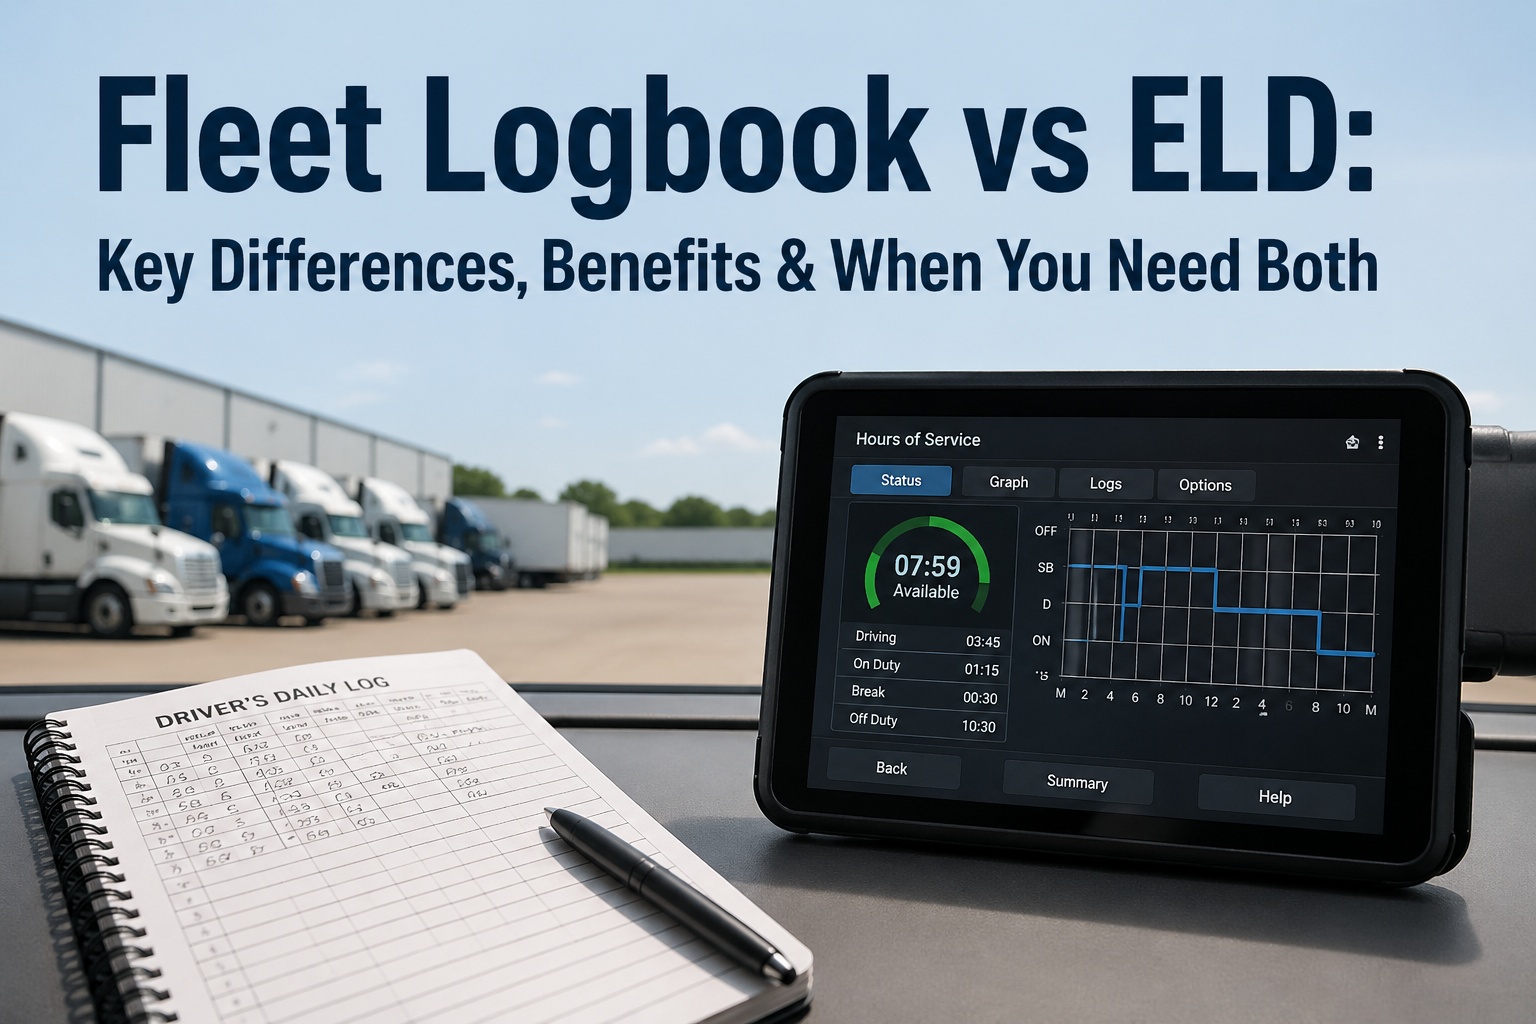
Paper DVIR vs. Digital Inspection Systems
The difference between paper and digital inspections determines whether pencil-whipping is possible or prevented by system design.
Paper DVIRs vs. Digital Inspection Platforms
Comparing accountability and fraud prevention capabilities
Capability
Paper DVIRs
Digital Inspections
Verification Method
Honor system—anyone can check all boxes with no proof
Photo requirements for critical items; GPS stamps location; timestamp proves duration
Fraud Detection
Impossible until accident investigation reveals falsified records
Real-time analytics flag suspicious patterns (too fast, always zero defects, missing photos)
Time to Pencil-Whip
47 seconds (check all boxes "OK")
Impossible—cannot proceed without required photos and minimum time thresholds
Defect Discovery Rate
2-5% (severely understated due to fraud)
18-25% (accurate rate with verified inspections)
Inspection Guidance
Generic checklist; drivers guess what to check and how
Step-by-step visual guides showing exactly where/how to inspect each item
Management Visibility
Review paper forms days later; cannot identify fraud
Real-time dashboard showing completion status, defect trends, outlier detection
Audit Trail
Handwritten signatures; easily forged; no timestamp proof
Digital signature with IP address, GPS coordinates, photo evidence, exact timestamps
Legal Defense
Plaintiff attorneys exploit pencil-whipped DVIRs for nuclear verdicts
Ironclad proof of honest inspection efforts; photos/timestamps defeat fraud claims
Digital inspection systems don't rely on driver honesty—they make fraud mechanically impossible through required photo evidence, GPS verification, and time-duration analysis. This transforms compliance from aspiration to certainty. Schedule a demo to see fraud prevention features in action.
See How Digital Inspections Prevent Pencil-Whipping
Watch how photo requirements, GPS verification, and intelligent time tracking make inspection fraud impossible while actually reducing completion time for honest inspectors.
Implementing Digital Inspections: 45-Day Plan
Transitioning from paper DVIRs to digital inspections eliminates pencil-whipping while improving inspection quality and reducing completion time.
45-Day Digital Inspection Deployment
Proven roadmap to eliminate inspection fraud
1
Days 1-10: Assessment & Configuration
Analyze current DVIR compliance rates and identify pencil-whipping patterns
Select digital inspection platform with photo requirements and GPS verification
Configure inspection checklists specific to your equipment types
Set photo requirements for critical safety items (brakes, tires, lights, fluids)
2
Days 11-25: Pilot & Training
Launch pilot with 10 vehicles/drivers; monitor completion rates and feedback
Train drivers on digital app usage and proper inspection techniques (45-minute sessions)
Address concerns about increased inspection time (typically offset by reduced paperwork)
Communicate zero-tolerance policy for inspection fraud; explain photo/GPS verification
3
Days 26-35: Fleet-Wide Rollout
Deploy digital inspections to all vehicles; eliminate paper DVIRs completely
Monitor completion rates and defect discovery; expect 18-25% defect rate (vs. 2-5% with fraud)
Establish daily review process for management; flag anomalies immediately
Integrate inspection data with maintenance system for automatic work order creation
4
Days 36-45: Optimization & Enforcement
Refine photo requirements based on field experience; add/remove as needed
Review analytics for outliers (too fast, suspiciously low defects, missing photos)
Enforce discipline for attempted fraud; use GPS/photo evidence in documentation
Measure ROI: defect discovery improvement, preventable accident reduction, insurance savings
Real Results: Before & After Digital Inspections
Fleet operators report dramatic improvements when digital inspection systems replace paper DVIRs vulnerable to pencil-whipping.
Digital Inspection Impact: 75-Truck Fleet Case Study
12-month comparison after implementing photo-verified inspections
Before Digital (Paper DVIRs)
12 months with pencil-whipping
Inspection Completion Rate:
94%
High completion but mostly fraudulent
Defect Discovery Rate:
3.2%
Suspiciously low; indicates widespread fraud
Preventable Accidents:
11 accidents
Brake, tire, light failures missed in "inspections"
Roadside Breakdowns:
47 incidents
Minor issues escalated to major failures
DOT Out-of-Service Rate:
8.3%
Well above 5.5% national average
Annual Costs:
$1,847,000
Accidents, penalties, repairs, downtime
After Digital (Photo-Verified)
12 months with accountability
Inspection Completion Rate:
99.2%
Verified honest completion with photo evidence
Defect Discovery Rate:
21.7%
Accurate rate; early detection prevents escalation
Preventable Accidents:
2 accidents
82% reduction; defects caught before failure
Roadside Breakdowns:
12 incidents
74% reduction; early intervention prevents failures
DOT Out-of-Service Rate:
2.1%
Well below national average; reflects true compliance
Annual Costs:
$492,000
73% cost reduction; $1.355M annual savings
Total Annual Savings:
$1,355,000
Frequently Asked Questions
Why Fleet Managers Choose Digital Inspections
✓
Fraud Prevention: Photo requirements make pencil-whipping mechanically impossible
✓
82% Fewer Accidents: Honest inspections catch defects before they cause failures
✓
Legal Protection: Timestamped photos prove inspection efforts during litigation
✓
Real-Time Visibility: Management sees completion status and defect trends instantly
✓
$1.35M Savings: Average annual cost reduction for 75-truck fleet
✓
Free Trial: Test fraud prevention features with your fleet at no cost
How common is pencil-whipping in commercial fleets?
Industry studies show 68% of commercial drivers admit to pencil-whipping inspections at least occasionally, with 34% doing so regularly. Paper DVIR systems create perfect conditions for fraud: zero accountability (no verification inspections occurred), no consequences (management can't detect fraud until accidents), and time pressure (thorough inspections delay profitable departures). The problem isn't driver dishonesty—it's system design that makes shortcuts inevitable. Digital inspections eliminate fraud by requiring photo evidence for critical items, GPS verification of location, and time-duration analysis that flags suspiciously fast completions. This transforms inspection quality from honor system to mechanical certainty.
What are the legal consequences of pencil-whipped DVIRs?
Legal exposure comes in three forms: (1) Regulatory penalties—FMCSA fines average $8,500 per violation; systematic inspection fraud triggers enhanced oversight and potential operating authority suspension. (2) Criminal liability—falsifying safety records can result in criminal charges if accidents cause injury/death; fleet managers face potential imprisonment for knowingly allowing fraud. (3) Civil litigation—plaintiff attorneys exploit pencil-whipped DVIRs to prove negligence and secure nuclear verdicts; falsified inspection records eliminate most legal defenses and dramatically increase settlement values. One transportation company faced $3.2M verdict when brake failure accident revealed 90+ consecutive DVIRs marked "brakes OK" without inspection. Digital inspections with timestamped photos provide ironclad proof of honest inspection efforts, defeating fraud claims.
Do digital inspections actually take longer than pencil-whipping?
Pencil-whipping takes 47 seconds (check all boxes "OK"). Honest paper DVIR takes 12-18 minutes. Digital inspections take 8-12 minutes—faster than honest paper inspections because: (1) visual guides show exactly where/what to inspect, eliminating guesswork; (2) pre-populated checklists reduce writing; (3) photos replace lengthy defect descriptions; (4) automatic timestamp/signature eliminates manual documentation. The time comparison that matters isn't digital vs. pencil-whipping—it's digital vs. honest paper inspections. Digital is 35-45% faster while providing far superior documentation quality and fraud prevention. Fleets save hundreds of hours annually through reduced paperwork while gaining certainty that inspections are actually performed.
How do digital inspections prevent pencil-whipping?
Digital systems make fraud mechanically impossible through four enforcement mechanisms: (1) Required photos—cannot mark "brakes OK" without uploading photo of brake pad thickness; cannot skip tire inspection without tread depth image. (2) GPS verification—timestamps and coordinates prove inspector was at vehicle location during inspection window. (3) Time analysis—system flags completions under minimum threshold (e.g., finishing 47-point inspection in 90 seconds triggers automatic management alert). (4) Pattern detection—analytics identify outliers like always reporting zero defects (statistically impossible) or identical completion times daily. Combined, these create 99.2% honest completion rates vs. 3-8% with paper DVIRs.
Start your free trial to see fraud prevention in action.
What ROI should fleets expect from digital inspections?
Typical ROI timeline: 2-4 months for medium-large fleets (25+ vehicles). Annual savings come from five sources: (1) Preventable accidents—82% reduction saves average $850K annually for 50-truck fleet. (2) Regulatory compliance—zero FMCSA inspection violations saves $85K+ in penalties. (3) Equipment life extension—catching defects early reduces catastrophic failures by 74%, saving $156K+ in avoided major repairs. (4) Insurance premiums—improved safety record reduces rates 18-25% within 2-3 years. (5) Downtime reduction—74% fewer roadside breakdowns saves $127K in lost revenue and emergency repairs. Total annual savings average $26,040 per vehicle. Digital inspection platform costs $45-85/vehicle/month, delivering 15-25x ROI in year one. Implementation takes 45 days from selection to fleet-wide deployment.