A $40 hydraulic hose fitting can idle a $300,000 excavator for a week if it is not in stock. A brake chamber that takes 3-10 business days to arrive keeps a Class 8 tractor parked at $2,000+ per day in lost revenue. The machine is not down because something broke — it is down because the part to fix it is not on the shelf. Parts-related delays are one of the largest preventable causes of heavy vehicle downtime. Yet 82% of construction fleets still rely on manual tracking for maintenance and parts, resulting in 40% higher failure rates compared to digitally managed operations. The real cost of poor parts inventory management compounds across every failure: emergency shipping premiums (3-5x standard), overtime labor for rushed repairs, rental equipment to cover the gap, missed delivery penalties, and the cascade of scheduling disruptions across the fleet. Meanwhile, parts costs continue climbing — Q4 2025 saw parts costs rise 3.7% year-over-year according to the Decisiv/TMC benchmark report, with tariff-driven increases on steel and aluminum components adding further pressure. Parts now represent the largest driver of rising maintenance costs industrywide, outpacing labor increases for the second consecutive year. Indirect expenses add another 35-45% on top of direct parts and labor costs. Fleets that implement structured parts inventory management — ABC analysis, min/max stocking, reorder point automation, PM-driven forecasting — reduce inventory carrying costs by 30-40% while achieving 95%+ parts availability and 91% fewer stockout events. A typical 100-vehicle heavy fleet saves $200,000-$300,000 annually in inventory costs alone. This guide covers why parts management fails for heavy fleets, how to set up a proper system, stocking strategies for heavy vehicle components, vendor management, and how HVI integrates parts tracking with inspections and work orders for end-to-end maintenance visibility. Book a demo to see HVI's parts inventory and fleet maintenance management platform, or start your free trial of HVI's integrated inspection, work order, and parts tracking system.
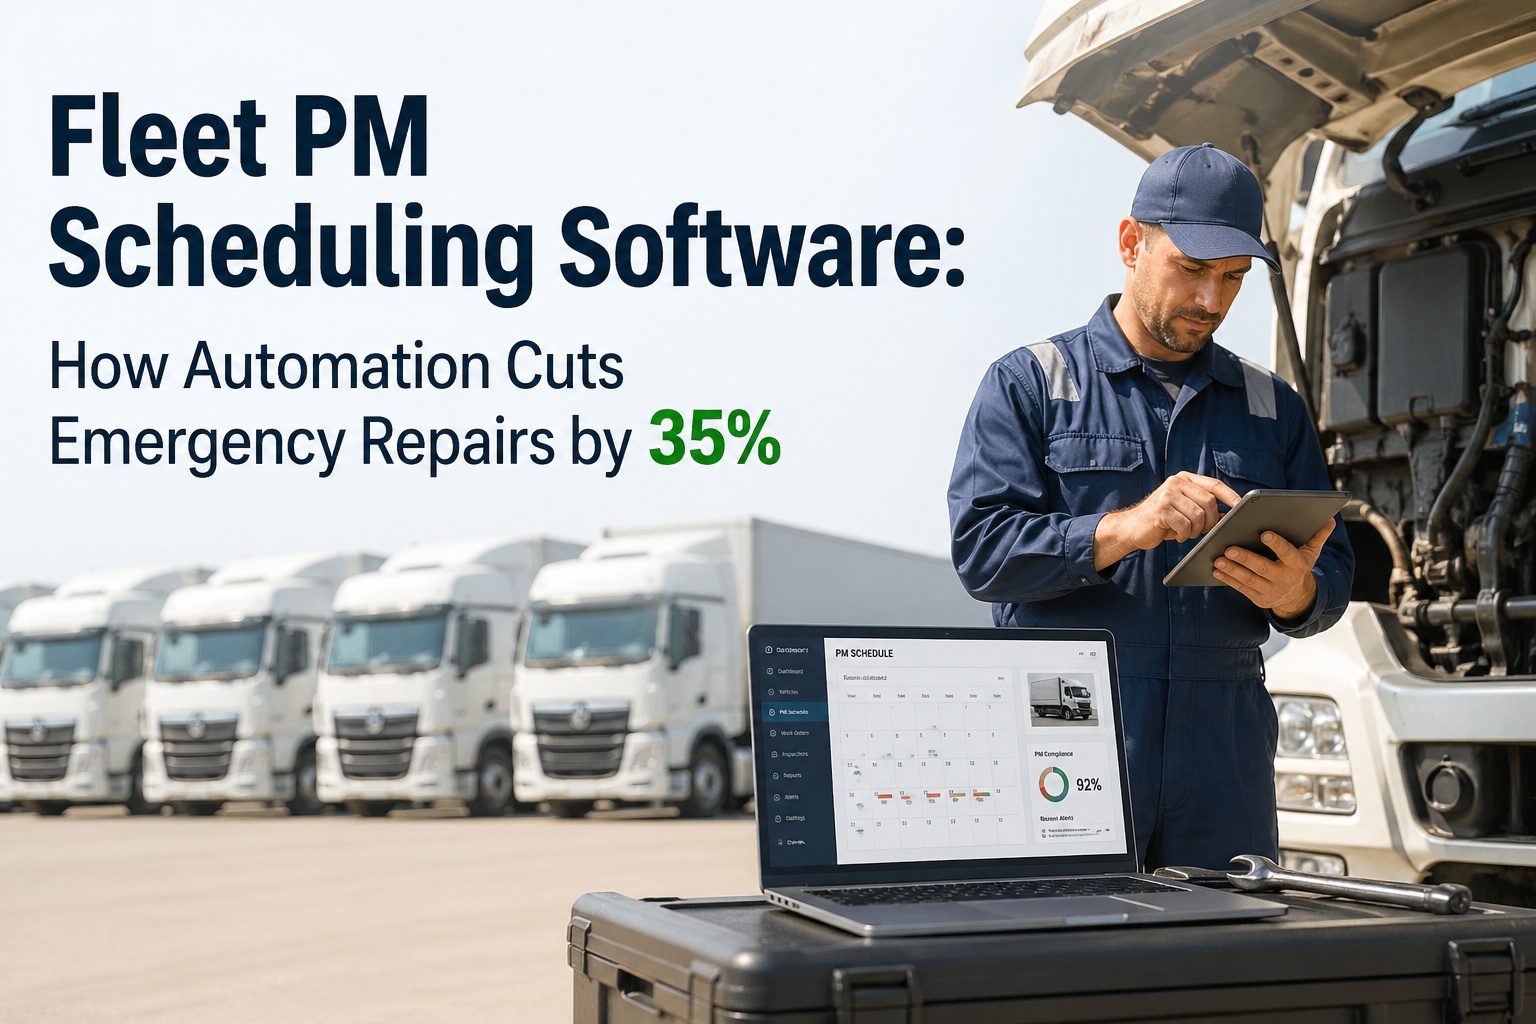
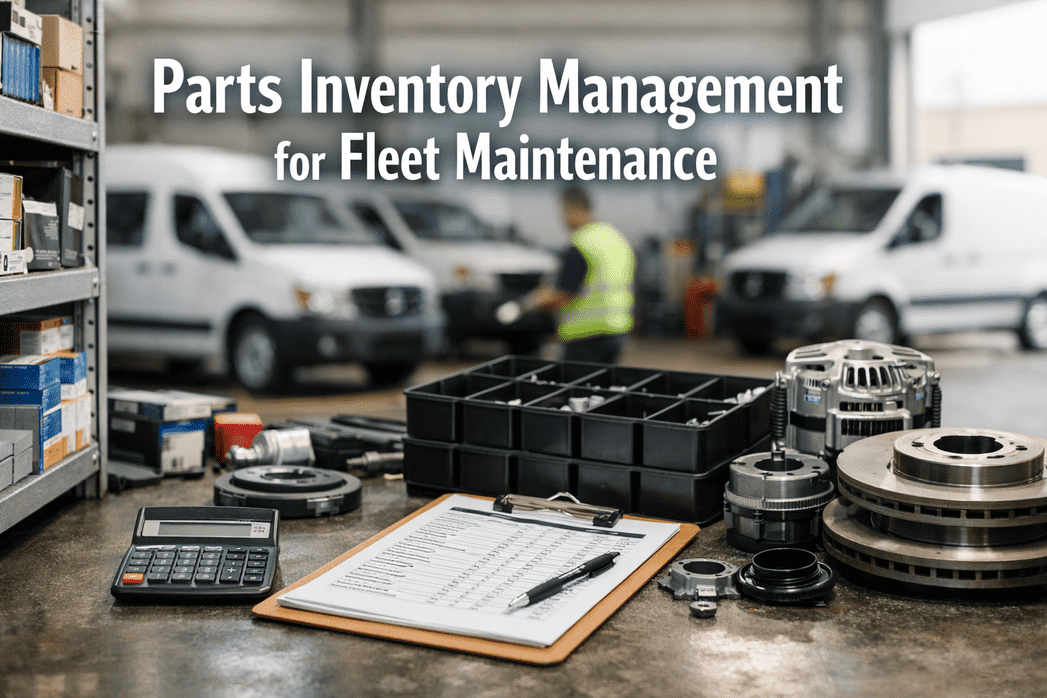
Parts Inventory Management for Heavy Vehicle Fleet Maintenance
Stock the right parts, at the right levels, for the right machines. Eliminate parts-related downtime, reduce inventory costs 30-40%, and connect every part consumed to the machine and work order that used it.
Annual inventory savings for 100-vehicle heavy fleet with optimized parts management
Reduction in inventory carrying costs through min/max automation and ABC analysis
Parts availability with automated reorder points — 91% fewer stockout events
Why Parts Inventory Fails for Heavy Vehicle Fleets
Heavy vehicle parts management is fundamentally different from general inventory. Component values range from $2 hardware to $30,000 hydraulic pumps. Lead times span 1 day to 4 weeks. A single missed critical spare can idle equipment worth hundreds of thousands of dollars. The failure patterns are specific to heavy fleets.
Ordering parts after equipment breaks guarantees maximum downtime. Hydraulic pumps take 2-4 weeks to arrive. Final drive components can take 3-6 weeks. During that time, a $300K machine sits idle at $2,000+/day. The $40 fitting that was not on the shelf costs $14,000+ in a single week of downtime. Reactive ordering is the most expensive parts strategy possible.
Spreadsheets, filing cabinets, and "the mechanic knows where it is" are not inventory systems. Without real-time visibility, parts get double-ordered (excess capital tied up), misplaced (phantom inventory inflates records), or used for one machine while another waits. Smaller fleets handle only 48% of maintenance in-house vs 62% for large fleets — making parts visibility even more critical when you cannot rely on scale.
When parts consumption is not tracked against specific vehicles, you cannot calculate true cost-per-hour, identify high-maintenance assets, compare identical machines for abnormal consumption, or predict future parts needs based on equipment history. Parts consumed without machine attribution are invisible costs that prevent data-driven fleet decisions.
If 10 trucks are due for PM service next month, you know exactly which filters, fluids, and components they need — in advance. Without PM-schedule integration, parts needs are discovered the morning the truck arrives for service. The mechanic walks to the parts room, finds the shelf empty, and the truck sits. PM-driven forecasting eliminates this completely.
Parts costs rose 3.7% year-over-year through Q4 2025, outpacing labor for the second consecutive year. Steel and aluminum tariffs (50% Section 232) are flowing directly into brake components, chassis parts, and structural hardware. Without vendor price tracking and purchase history analysis, fleets have no leverage to negotiate or identify cost-saving alternatives like remanufactured components.
Heavy fleets often operate from multiple yards, shops, or job sites. The part your mechanic needs may exist at another location 30 miles away — but without multi-site visibility, a new purchase order goes out instead. Duplicate purchasing across locations is one of the largest hidden inventory costs for distributed fleet operations.
ABC Analysis: How to Stock Heavy Vehicle Parts
Not all parts deserve the same stocking strategy. ABC analysis classifies parts by value and criticality to optimize inventory investment. This is the foundation of professional fleet parts management — and most heavy fleets skip it entirely.
Parts that halt equipment if unavailable. Hydraulic pumps, final drive components, engine assemblies, transmission parts, turbochargers, injectors. Stock aggressively with safety stock. Lead times of 2-6 weeks make reactive ordering devastating. Your top 20 failure parts from the last 12 months should never be out of stock — this list typically covers 80% of unplanned demand. Track individually with serial numbers and warranty dates.
Important but not immediately machine-stopping. Filters (oil, fuel, air, hydraulic), belts, brake pads and shoes, coolant hoses, wiper blades, light bulbs. Stock at moderate levels based on PM schedule demand. If 10 trucks are due for 250-hour service next month, calculate filter and fluid needs in advance. Predictable consumption with seasonal variation — adjust quarterly.
Low-cost, low-impact items. Grease fittings, hardware (bolts, nuts, washers), O-rings, gaskets, electrical connectors, cable ties, shop supplies. Order in bulk with minimal individual tracking. Do not waste management attention on counting $0.50 items individually — use two-bin or kanban systems. Set high max levels and reorder infrequently in large quantities.
Setting Min/Max Levels and Reorder Points
The reorder point formula ensures you never run out without over-ordering: Minimum = (Average Daily Usage x Lead Time) + Safety Stock. Maximum = Minimum + Economic Order Quantity. Review quarterly as fleet size, utilization, and vendor lead times change. A CMMS automates these calculations using actual consumption data — not guesswork.
Usage: 2 filters per week (0.4/day). Lead time: 5 business days. Safety stock: 2 units. Minimum = (0.4 x 5) + 2 = 4 filters. When stock hits 4, the system automatically generates a purchase order. Maximum = 4 + EOQ (typically 10-20 for filters) = 14-24 filters. This range prevents both stockouts and excess capital tied up in shelf inventory.
Usage: 1 per month (0.03/day). Lead time: 10 business days. Safety stock: 1 unit (critical — cannot operate without brakes). Minimum = (0.03 x 10) + 1 = 1.3 (round up to 2). Maximum = 2 + EOQ (2-4 units) = 4-6 chambers. Low volume but high criticality — safety stock is essential because a single brake chamber stockout parks a revenue-generating truck.
Usage: 20 gallons/week. Lead time: 3 business days. Safety stock: 10 gallons. Minimum = (2.9/day x 3) + 10 = 18.7 gallons (round to 20). Maximum = 20 + EOQ (55 gallon drum = 55). Order by the drum when stock drops to 20 gallons. Bulk pricing on commodity items reduces per-unit cost 15-25% compared to case purchases.
The most powerful enhancement to min/max: integrate with your PM scheduler. If 10 trucks are due for 250-hour service next month, the system calculates: 10 oil filters + 10 fuel filters + 10 air filters + 150 gallons oil = total demand. Compare against current stock. Generate purchase requests for shortfalls automatically. Zero surprises, zero emergency orders, zero "we forgot to order filters."
Vendor Management and Cost Control
Fleets that track vendor performance data — pricing, response time, fill rate, shipping reliability — achieve 15-25% lower parts costs than fleets ordering on relationships alone. In a rising-cost environment (parts up 3.7% YoY), vendor management is no longer optional.
The same part number from different vendors can vary 20-40% in price. Without purchase history in a centralized system, you cannot compare. Digital vendor profiles with pricing history enable side-by-side comparison before every order. Penske and DTNA both reported recalibrating vendor strategies during the 2024-2025 freight recession — diversifying sources to avoid single-source risk.
Fleets are increasingly open to remanufactured and value-line alternatives. DTNA has targeted aftermarket replacement solutions for legacy parts. Reman starters, alternators, brake calipers, and turbochargers deliver 70-90% of OEM life at 40-60% of cost. Track reman vs OEM performance per component in your CMMS to build data-driven decisions about which parts justify OEM pricing.
Parts replaced under warranty represent recovered costs — but only if you track warranty dates, document failures properly, and file claims promptly. HVI tracks warranty expiration dates per part and per machine. When a technician replaces a warranted component, the system flags it for claim submission. Fleets with systematic warranty tracking recover 3-8% of annual parts spend.
Emergency overnight shipping costs 3-5x standard. Planned bulk purchasing reduces per-unit cost 15-25%. The difference between "reactive" and "proactive" parts management is not convenience — it is a measurable cost line. Track emergency order frequency and cost as a KPI. Declining emergency orders = improving inventory management.
HVI Parts Inventory Management for Heavy Fleets
HVI connects parts inventory with inspections, work orders, PM schedules, and cost tracking in a single platform. Every part consumed is linked to a specific machine, a specific work order, and a specific mechanic — building true cost-per-hour data that drives fleet decisions.
Every part consumed is logged against a specific vehicle and work order. This builds true cost-per-hour profiles per machine: which trucks cost the most, which components fail most often, when maintenance costs exceed replacement threshold. Without machine-level parts tracking, your fleet financials are guesswork.
Set minimum and maximum stock levels per part. When inventory hits the minimum threshold, HVI automatically generates a reorder alert or purchase request. No manual counting, no surprise stockouts, no over-ordering. Dynamic reorder points adjust based on actual consumption data from your fleet — not static estimates.
Check if the part exists at another location before ordering new. Transfer parts between sites with digital documentation. Fleet-wide inventory view across all yards, shops, and job sites. Eliminate duplicate purchasing that wastes capital — the part you need may already be on a shelf 30 miles away.
HVI's PM scheduler knows which machines are due for service and when. The system calculates parts requirements for upcoming PMs — filters, fluids, components — compares against current stock, and generates purchase requests for shortfalls. Parts are on the shelf before the truck arrives for service. Zero emergency orders, zero mechanic downtime waiting for parts.
When a driver reports a defect during pre-trip inspection, HVI generates a work order. The work order identifies parts needed. The system checks inventory. If the part is in stock, it is reserved. If not, a purchase request is generated immediately. The chain from "driver finds a problem" to "part is ordered" happens in seconds — not hours or days. .
Centralized vendor profiles with pricing history, purchase frequency, and fill rate performance. Compare vendor pricing before every order. Track warranty dates and flag warranted failures for claim recovery. Monitor emergency order frequency as a KPI. Budget variance tracking shows actual parts spend against plan — by machine, by category, by vendor.
Frequently Asked Questions
It depends on fleet size, equipment diversity, and proximity to parts distributors. A general guideline: carry 2-4 weeks of A items (critical spares), 1-2 weeks of B items (PM consumables), and bulk stock of C items (commodity). Your top 20 failure parts from the last 12 months should never be out of stock — this list typically covers 80% of unplanned demand. HVI's consumption reports identify these top parts automatically. Book a demo to see how HVI optimizes inventory levels for your heavy vehicle fleet.
Far more than the part itself. A stockout on a $40 hydraulic fitting idles a $300K machine at $2,000+/day until the part arrives. Add emergency shipping (3-5x standard), overtime labor for rushed repair, rental equipment to cover the gap, and cascading schedule disruptions. A single critical stockout can cost $10,000-$20,000 in total impact. Prevention through min/max automation costs a fraction of one stockout event. Start your free trial of HVI's parts inventory management with auto-reorder alerts.
Reorder Point = (Average Daily Usage x Lead Time in Days) + Safety Stock. Use at least 12 months of consumption history to calculate average daily usage. Factor in lead time variability (use worst-case, not average), seasonal demand patterns, and desired service level (95%+ availability for A items). HVI calculates reorder points automatically from actual consumption data and adjusts dynamically as usage patterns change. Book a demo to see automated reorder point management for heavy fleet parts.
It depends on the component. Critical safety items (brakes, steering, suspension) — use OEM or equivalent. PM consumables (filters, belts) — quality aftermarket is often 30-50% cheaper with equivalent performance. Remanufactured components (starters, alternators, turbochargers) deliver 70-90% of OEM life at 40-60% of cost. Track OEM vs aftermarket performance per component in HVI to build data-driven sourcing decisions. See how HVI tracks parts performance by vendor and component type.
HVI creates a closed loop: driver reports defect during inspection → work order generated → parts identified and checked against inventory → if in stock, reserved for repair; if not, purchase request generated → repair completed → parts consumed logged against specific machine and work order → cost-per-hour updated. This end-to-end chain ensures no defect waits for parts longer than necessary and every dollar spent is attributed to the right machine. Start your free trial of HVI's integrated inspection, work order, and parts management platform.
Yes. HVI provides fleet-wide inventory visibility across all locations — yards, shops, job sites. Check if a part exists at another site before ordering new. Transfer parts between locations with digital documentation. Each part tracks up to 5 unique storage locations. For heavy fleets operating from multiple depots or construction sites, multi-site visibility eliminates duplicate purchasing and reduces total inventory investment by 15-25%. Book a demo to see multi-site parts inventory management for your heavy vehicle fleet.
Stop Losing $2,000/Day to Missing Parts. Start Managing Inventory Today.
Every part linked to a machine and work order. Min/max with auto-reorder. PM-driven forecasting. Multi-site visibility. Vendor cost tracking. Warranty recovery. One platform connecting inspections, work orders, and parts for your entire heavy vehicle fleet.
No credit card • Parts + inspections + work orders in one platform • Multi-site ready • Barcode scanning included