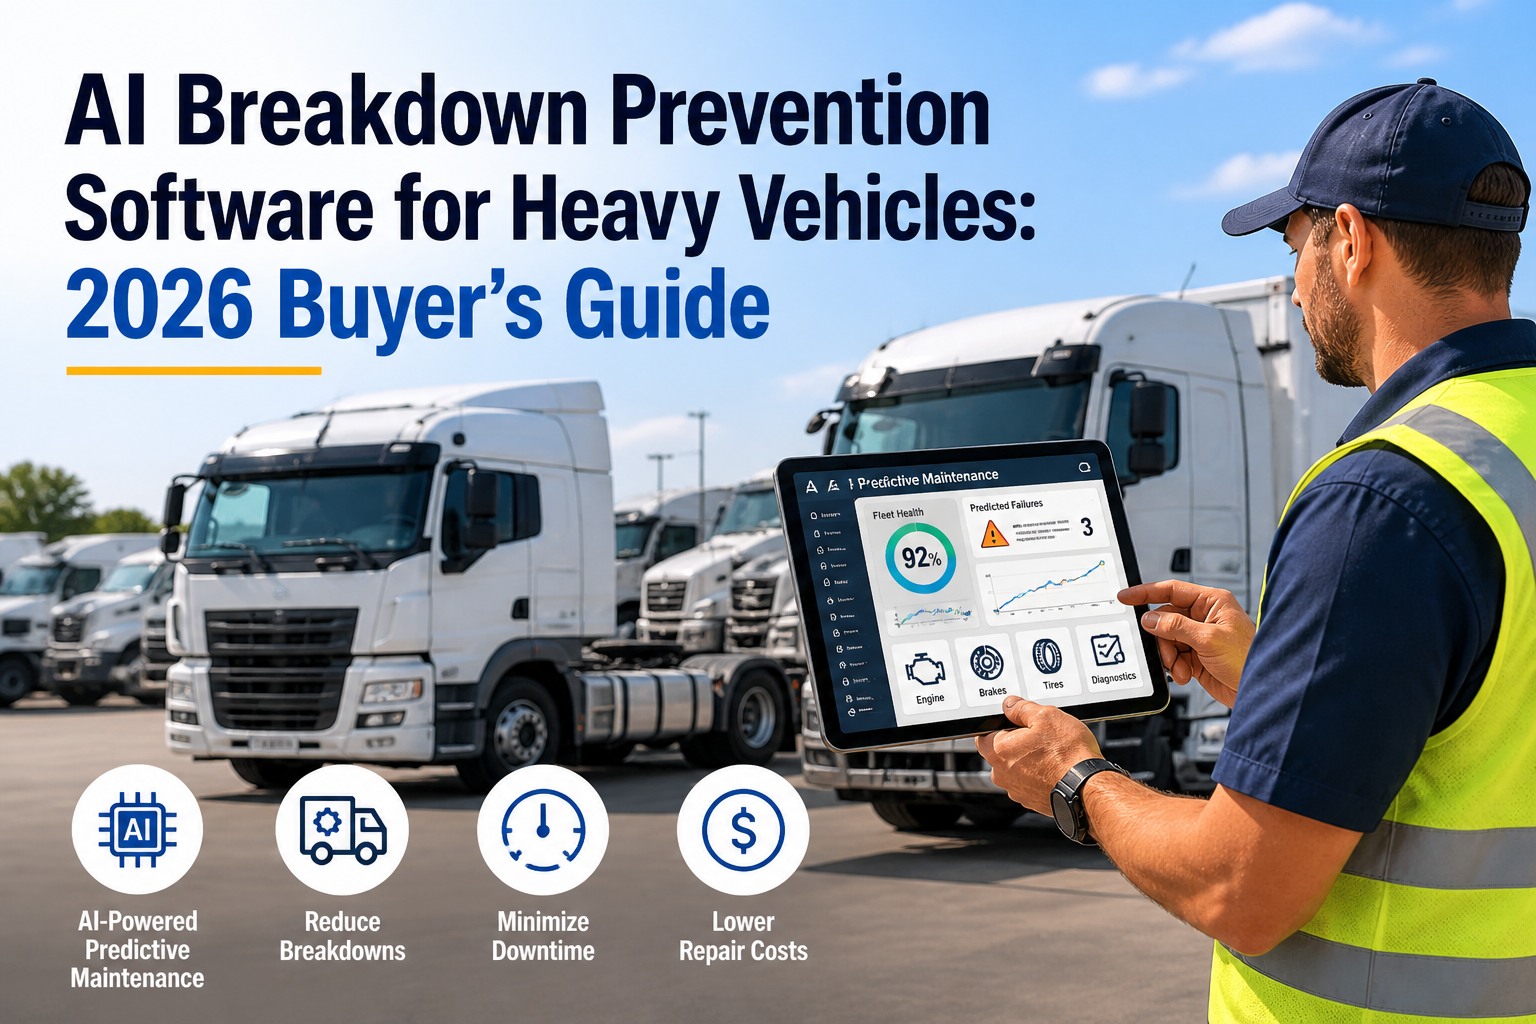
Most fleets think they have a good inspection program. Most fleets are wrong. Only 5% achieve near-perfect maintenance compliance. Only 27% currently use predictive maintenance, even though 65% plan to adopt AI by end of 2026. The average carrier operates 10,600 miles between breakdowns — top-performing fleets achieve over 75,000 miles. That 7x difference maps directly to inspection program maturity. Maintenance represents 15-20% of total fleet costs, emergency repairs cost 3-9x more than planned maintenance, and every hour of unplanned downtime costs approximately $448 in lost revenue. This maturity model gives you a framework to honestly assess your stage, understand what each stage looks like in practice, and build a concrete roadmap to advance.
The Four Stages of Fleet Inspection Maturity
1
Reactive
Fix When Broken
~45% of fleets
▶
2
Standardized
Consistent Process
~30% of fleets
▶
3
Data-Driven
Analytics-Led
~20% of fleets
▶
4
Predictive
AI-Powered
~5% of fleets
Each stage builds on the one before it. You can't skip stages — but you can accelerate through them.
Why Inspection Maturity Matters More Than Ever in 2026
Three forces are converging in 2026 that make maturity advancement existential for carriers.
⚠
FMCSA Data-Driven Oversight
Continuous safety ratings replace periodic audits. Your inspection records feed your safety score every month. The new CSA Driver Observed category tracks defects drivers should have caught — Stage 1 fleets can't even measure this. Stage 3-4 fleets track it automatically.
★
Shipper & Insurer Screening
Average trucking verdict: $27.5M (2020-2023). $4.1B in mega-verdicts in 2024. Major shippers now screen carriers on CSA scores and documented programs. Stage 1-2 carriers see premium increases of 20-40% while Stage 3-4 fleets negotiate 10-15% reductions.
⚙
Technology Cost Collapse
Digital inspections now cost $15-45/vehicle/month with ROI in 60-90 days. IoT sensor costs dropped 60% since 2022. The $27B fleet management market is growing to $122B by 2035. The barrier isn't cost — it's leadership willingness.
Stage 1: Reactive — Fix It When It Breaks
Approximately 45% of fleets operate here. Inspections happen because regulations require them, not because the organization values them. The fleet is in permanent firefighting mode: breakdowns drive maintenance, not the other way around. Maintenance costs run $0.15-0.25+ per mile, with 25-35% consumed by unexpected breakdowns.
Inspection Method
Paper DVIRs, often pre-signed or completed in under 3 minutes. No photo evidence. No way to verify actual completion. Forms filed in boxes, rarely reviewed. Fleets spend $15,000+/year on paper storage alone.
Defect Response
Verbal reports to supervisor or sticky notes. No work order system. Average repair delay: 3-7 days. Many defects never addressed until catastrophic failure. Paper handoff creates 2-4 hour escalation delays.
Data & Compliance
Zero analytics — no completion tracking, no trend analysis. CSA scores unknown until they cause contract losses. During audits, staff scramble to produce records within the 48-hour window. 93% of carriers receive audit violations.
Cost & Risk
Unplanned downtime: $448/hour. Emergency repairs 3-9x costlier than planned. Insurance premiums 20-40% above average. Maximum legal liability — no defensible records. Nuclear verdict risk: HIGH ($27.5M avg trucking verdict).
⚠ You're at Stage 1 if: You can't state your DVIR completion rate right now. Drivers sign paper forms. You discover defects when trucks break down. Your filing cabinet is your compliance system.
Ready to leave Stage 1? Start your free HVI trial — digital inspections identify 40% more defects and reduce errors by 35%. Or book a demo to see the Stage 1 to 2 transition.
Stage 2: Standardized — Consistent Process, Early Visibility
The biggest single leap in maturity. Digital transformation creates the data foundation everything else builds on. 68% of fleets have digitized some portion of inspections. Transition takes 30-60 days with first ROI in 60-90 days.
Inspection Method
Digital platform with guided checklists, GPS/timestamp verification, and photo requirements. Consistent format across all drivers. Digital DVIRs take 5-10 min vs. 20+ for paper, saving 25,000+ driver-hours/year for a 50-driver fleet.
Defect Response
Defects auto-generate work orders with photos, notes, and vehicle history. Maintenance gets instant notifications. Response time: 24-48 hours. Drivers notified when repairs complete, building trust in the system.
Data & Compliance
Basic dashboards: completion rate, defects reported, work order status. Audit-ready documentation from day one — records retrievable in seconds (63x faster than paper). CSA scores monitored monthly with automatic alerts.
Cost & Risk
35% reduction in emergency repairs. Inspection costs drop from $4.50-$7.00 (paper) to $0.80-$1.50 (digital). Recordkeeping costs slashed 70%. Accuracy jumps from 70-80% to 95-99%. 47% of fleets see ROI in under one year.
☑ You're at Stage 2 if: You have digital inspections and know your completion rate, but you're not yet using data to predict problems or coach individual drivers on quality scores.
Stage 3: Data-Driven — Insights That Drive Decisions
Inspection data becomes a strategic management tool. The fleet analyzes trends, coaches drivers on quality metrics, and correlates internal data with roadside outcomes. About 20% of fleets reach this level — they see maintenance costs decline 20-30% and insurance premiums drop 10-15%.
Inspection Method
Quality scoring algorithms with driver scorecards tracking completion quality, photo compliance, and defect detection rate. Adaptive checklists adjust based on vehicle age, history, and seasonal risks. Zero-defect anomaly detection flags suspicious patterns.
Defect Response
Automated severity-based prioritization — safety-critical defects ground vehicles immediately. Recurring defects trigger root-cause analysis, not just repair. Average response under 12 hours. MTTR tracked and optimized.
Data & Compliance
Multi-dimensional analytics: trends by vehicle, component, driver, route, and season. Quality scores correlated with roadside outcomes. MTBF tracked per component. PM compliance targets 95%+. Internal metrics predict roadside results 4-6 weeks ahead.
Cost & Risk
Maintenance costs down 20-30%. Insurance premiums decline 10-15%. Violations reduced 40-60%. Cost per mile: $0.08-0.15. Scheduled/unscheduled ratio: 80/20. Strong legal defense with documented coaching and continuous improvement evidence. ROI: 300-400%.
★ You're at Stage 3 if: You coach drivers based on inspection quality scores, correlate internal data with roadside outcomes, run defect trend analysis, and leadership reviews analytics weekly.
HVI gives you Stage 3 analytics out of the box — scorecards, trend analysis, quality scoring, anomaly detection, and CSA correlation. Start free or schedule a demo to see data-driven inspection management.
Stage 4: Predictive — Anticipate Before It Fails
Only ~5% of fleets operate here, but results are transformative: 32% reduction in unplanned downtime, 20-40% lower maintenance costs. This stage integrates inspections with telematics, IoT sensors, and AI to predict failures before they happen. A Texas contractor saw 73% fewer hydraulic failures and saved $210K annually on 35 excavators.
Inspection Method
AI-augmented inspections pre-populate risk areas based on telemetry, sensor data, and component age. Drivers focus where failure probability is highest. Digital twin technology models each vehicle continuously. Inspections become targeted, not generic.
Defect Response
Predictive alerts trigger maintenance before driver-observed defects appear. Replacement scheduled on remaining useful life, not failure. Unplanned breakdowns reduced 32%+. Parts inventory optimized through predictive demand. Emergency costs drop 40-60%.
Data & Compliance
ML models analyze inspections + telematics + work orders + sensors to predict failures weeks ahead. System forecasts CSA score trajectory months in advance. Compliance is automated and continuous. Audits are a non-event.
Cost & Risk
ROI: 500%+. Cost per mile: $0.03-0.08. Insurance at lowest tier. 2-4x ROI within 12-24 months. First prevented breakdown often pays for the system. Minimal legal exposure — industry-leading documentation. Nuclear verdict risk: MINIMAL.
◆ You're at Stage 4 if: Your system predicts which components fail next week. Inspections target AI-scored risk areas. Maintenance budgets forecast component lifecycles. Breakdowns surprise competitors, not you.
The Maturity Comparison: Side-by-Side Impact
DVIR Completion Rate
60-75%
90-95%
97-99%
99.5%+
Defect Miss Rate
20-30%
10-15%
5-8%
Under 3%
Miles Between Breakdowns
10,000-15,000
25,000-40,000
50,000-65,000
75,000+
Maintenance Cost/Mile
$0.15-0.25+
$0.10-0.18
$0.08-0.15
$0.03-0.08
Repair Response Time
3-7 days
24-48 hrs
Under 12 hrs
Pre-scheduled
Insurance Impact
+20-40% premium
Market rate
-10-15% savings
Lowest tier
Legal Defense
Weak
Adequate
Strong
Industry-leading
Cumulative ROI
Negative
100-200%
300-400%
500%+
The Financial Case: 50-Truck Fleet Cost Breakdown
Abstract maturity levels don't get budget approval — dollar figures do. This shows annual costs for a 50-truck fleet averaging 100,000 miles/vehicle/year.
Total Maintenance
$1,000,000
$700,000
$550,000
$300,000
Emergency Repairs
$250,000
$112,500
$62,500
$25,000
Downtime + Violations
$176,400
$79,200
$30,880
$7,220
Insurance + Admin
$102,000
$9,600
-$27,000
-$46,500
Technology Investment
$0
$18,000
$24,000
$54,000
Total Annual Cost
$1,528,400
$919,300
$640,380
$339,720
Savings vs. Stage 1
—
$609,100
$888,020
$1,188,680
Stage 1 costs $609,100+ per year more than Stage 2 alone. Start your free HVI trial — most fleets reach Stage 2 within 30-60 days. Or book a demo to calculate savings for your fleet.
Industry-Specific Maturity Challenges
Different industries get stuck at different stages. Understanding your typical sticking point helps you plan around it.
Challenge: Dispersed drivers, paper culture, veteran resistance to digital tools seen as surveillance.
Fix: Offline-capable mobile apps, champion drivers at each terminal, competitive scorecards, and focus on time savings (5-10 min vs. 20+ for paper).
Challenge: Variable equipment types, harsh environments, rotating operators complicate driver-specific analytics.
Fix: Equipment-specific checklists with photo references. Component-based trend analysis instead of driver-based. Predictive focus on highest-cost failure modes first.
Challenge: 50-80% annual driver turnover, time pressure from delivery windows, management treats inspections as cost.
Fix: Quality scoring with automatic alerts for sub-3-minute inspections. Onboarding automation. Show managers: fewer breakdowns = more on-time deliveries.
Challenge: Extreme conditions degrade sensors, limited connectivity, MSHA/OSHA complexity, legacy system integration gaps.
Fix: Ruggedized IoT on highest-value assets first. Offline-capable platforms. Digital twins for 6-figure equipment. Unified MSHA/OSHA/DOT compliance tracking.
5 Maturity Killers That Stall Advancement
70% of digital transformation initiatives fail. These are the most common inspection maturity traps.
1
Technology Without Culture Change
Buying a digital platform but not changing expectations or management behavior. Without dashboard reviews, accountability, and defect follow-through, you just digitize mediocrity.
Fix: Leadership must review inspection dashboards weekly and act on the data.
2
Broken Defect Response Loop
Drivers report defects but nothing happens. If a driver reports a cracked windshield and the truck goes out next day unchanged, that driver never reports again. Response speed signals how much the organization values safety.
Fix: Every defect needs a response — even "monitored, scheduled for next PM." Close the loop visibly.
3
Skipping the Data Foundation
Jumping from Stage 1 to Stage 3 or 4 without clean digital data. AI and analytics need 6-12 months of consistent inspection data. Bad data = bad predictions.
Fix: Target 95%+ completion rate for 6 months at Stage 2 before activating advanced analytics.
4
Inspections Delegated, Not Led
Management delegates entirely to drivers and safety managers. Fleets where leadership reviews analytics weekly advance 2x faster than those that delegate entirely.
Fix: Make inspection maturity a leadership KPI alongside revenue and cost-per-mile.
5
Data Without Action (Stage 2 Plateau)
Beautiful dashboards, comprehensive data — but nobody uses it to make different decisions. Stage 2 to 3 is a behavioral shift, not a technology upgrade.
Fix: For every metric, define the action triggered when it crosses a threshold. No metric without a response plan.
How to Advance: Stage-by-Stage Roadmap
Stage 1
▶
Stage 2
30-60 days
Key Actions
Deploy digital inspection platform. Replace paper completely. Configure equipment-specific checklists with photo-required checkpoints. Set up defect-to-work-order automation. Train drivers in layers over 2 weeks with champions at each terminal.
Investment
Software: $15-45/vehicle/month. Training: 2-4 hours/driver over 2 weeks. Hardware: existing smartphones. 50 trucks: ~$9K-27K/year software + 200 hrs training.
Expected Impact
Completion rate: 60-75% → 90%+. Defect detection +35%. Emergency repairs decline within 60 days. Audit-ready from day one. ROI: 100-200% in year one. Highest ROI per dollar of any stage transition.
Stage 2
▶
Stage 3
90-180 days
Key Actions
Activate driver scorecards and quality scoring. Implement anomaly detection. Run monthly defect trend analysis. Correlate quality scores with roadside outcomes. Start data-driven coaching. Review analytics in weekly leadership meetings.
Investment
Analytics: often included or $5-15/vehicle/month. Safety manager training: 4-8 hrs. Leadership: 1 hr/week analytics review. Coaching: 30 min/flagged driver/month.
Expected Impact
Miss rate: 10-15% → 5-8%. Roadside pass: 93-96%. Maintenance costs -20-30%. Insurance -10-15%. Scheduled ratio reaches 80/20. Incremental ROI: 100-200%.
Stage 3
▶
Stage 4
6-12 months
Key Actions
Integrate telematics with inspection platform. Deploy IoT sensors on brakes, tires, suspension, cooling. Implement AI failure prediction trained on 12+ months of fleet data. Build predictive scheduling on remaining useful life. Digital twin models for top assets.
Investment
IoT sensors: $50-200/vehicle. AI platform: $30-75/vehicle/month. Integration: 40-80 hrs setup. 50 trucks: ~$30K-54K/year incremental.
Expected Impact
Unplanned downtime -32%+. Costs 20-40% below average. Pass rate 97%+. Insurance at lowest tier. ROI: 500%+ cumulative. First prevented breakdown pays for the system.
Start your maturity journey. Try HVI free — scales from Stage 1 paper replacement through Stage 3 analytics, with integrations ready for Stage 4. Or book a demo to plan your advancement.
Maturity Isn't Optional in 2026. It's Competitive Survival.
Advancing from Stage 1 to Stage 2 saves a 50-truck fleet over $600,000 annually. Reaching Stage 3 saves nearly $900,000. Stage 4 saves over $1.1 million. The technology costs a fraction — digital inspections run $15-45/vehicle/month, and 47% of fleets see positive ROI in under 6 months. The fleets winning in 2026 aren't the ones with the newest trucks — they're the ones with the most mature inspection programs. Start where you are. Advance one stage. Measure the improvement.
Advance Your Inspection Maturity — Starting Today
HVI helps fleets at every stage: digital transformation for Stage 1 to 2, analytics for Stage 2 to 3, and integration-ready architecture for Stage 3 to 4.
Frequently Asked Questions
Q: How do I determine what maturity stage my fleet is at?
Three questions: (1) Can you state your DVIR completion rate right now? No = Stage 1. (2) Do you coach drivers based on inspection quality scores? No = Stage 2. (3) Does your system predict failures before drivers observe them? No = Stage 3. Yes to all = Stage 4. Most fleets overestimate by one level.
Start free to measure with real data.
Q: Can small fleets (10-50 trucks) reach Stage 3 or 4?
Stage 3 — absolutely. Cloud platforms provide scorecards, trends, and quality scoring for 10-truck fleets as well as 500-truck operations. Small fleets often see higher percentage ROI because one prevented breakdown has outsized impact on tight margins.
Book a demo for your fleet size.
Q: What's the ROI difference between stages for a 50-truck fleet?
Stage 1 to 2: ~$609,100/year savings ($12,182/truck). Stage 2 to 3: +$278,920/year. Stage 3 to 4: +$300,660/year. Total 1 to 4: ~$1,188,680/year. Technology at Stage 4 costs ~$54,000/year — a 22:1 return.
Sign up free to measure ROI from day one.
Q: How long does it take to advance from Stage 1 to Stage 3?
6-9 months total with consistent effort. Stage 1 to 2: 30-60 days. Stage 2 to 3: 90-180 days after Stage 2 stabilizes. The critical factor: fleets where leadership reviews analytics weekly advance 2x faster. Stage 3 to 4 adds 6-12 months.
Q: How does maturity affect 2026 FMCSA compliance?
FMCSA's continuous data-driven ratings mean inspection records feed your safety score monthly. The new CSA Driver Observed category tracks defects drivers should have caught — Stage 1-2 fleets can't measure this; Stage 3-4 track it automatically. Major shippers enforce violation metrics with hard deadlines. Higher maturity = better scores = more contracts = lower insurance.
Schedule a demo to see compliance tracking.