Most fleet dashboards are data graveyards — 40 metrics displayed with equal visual weight, updated weekly from last month's spreadsheets, and reviewed by managers who already know what the numbers will say. That is not a driver dashboard. That is a reporting delay with a login screen. An enhanced driver dashboard transforms raw telematics and inspection data into real-time, actionable KPIs that drivers and managers can see, understand, and act on within the same shift. When a driver's safety score drops, they see it. When a vehicle's fuel efficiency declines, the dashboard flags it before the monthly report. When DVIR completion rates slip at a terminal, management knows before the DOT auditor does. HVI's enhanced driver dashboard delivers this shift — moving fleet performance management from rearview-mirror reporting to real-time decision-making that changes driver behavior, cuts costs, and strengthens compliance every day.
The Dashboard That Drivers Actually Use
The difference between a dashboard people look at and one that changes behavior comes down to three UI design principles that most fleet platforms ignore.
Real-Time, Not Last-Week
KPIs update continuously from telematics, inspection data, and work order completions — not from end-of-month CSV imports. A driver sees their safety score change after today's pre-trip, not after next week's report. Managers see PM compliance drift within 24 hours, not when the quarterly review reveals the gap.
Impact: Fleets with real-time dashboards reduce time-to-action by 85% — from days to hours.
3–4 North Stars, Not 40 Metrics
High-performing fleets prioritize 3–4 KPIs at the top — cost per mile, vehicle availability, PM compliance, safety score — with one-click drill-down to diagnostic metrics beneath. A dashboard tracking 40 metrics with equal weight creates "dashboard blindness" where nothing stands out and nothing changes.
Impact: Focused dashboards drive 3x more corrective actions than metric-overloaded displays.
Action-Linked, Not Display-Only
Every KPI connects to a specific action: a declining safety score triggers a coaching session, a missed PM auto-generates a work order, an inspection gap sends an alert to the terminal supervisor. The dashboard does not just show problems — it initiates the response workflow.
Impact: Action-linked KPIs close the gap between detection and correction by 70%.
The 8 KPIs That Transform Fleet Performance
These are the KPIs that separate top-quartile fleets from average performers. Each one is measurable from existing inspection and telematics data — and each connects directly to a financial outcome.
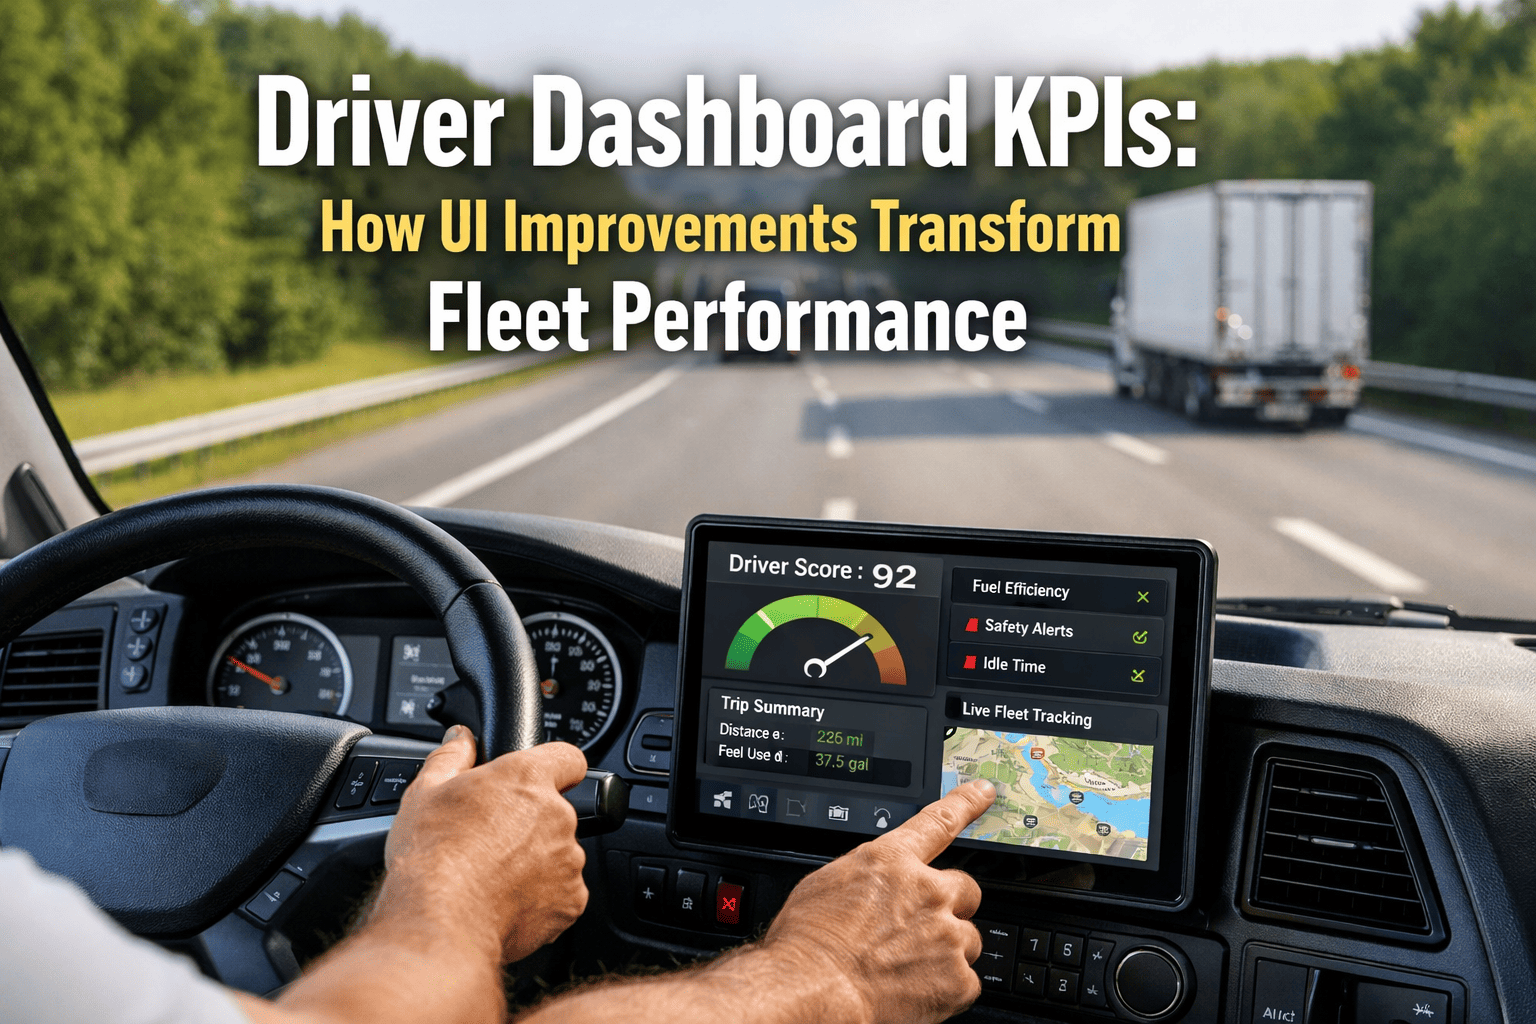
Driver Safety Score
Composite of harsh braking + speeding + cornering + phone use + DVIR completion
Top quartile:92+
Average:74
Risk threshold:<60
Dashboard action: Score below 70 triggers coaching alert. Below 60 flags for immediate intervention. Trend decline over 2 weeks triggers supervisor review.
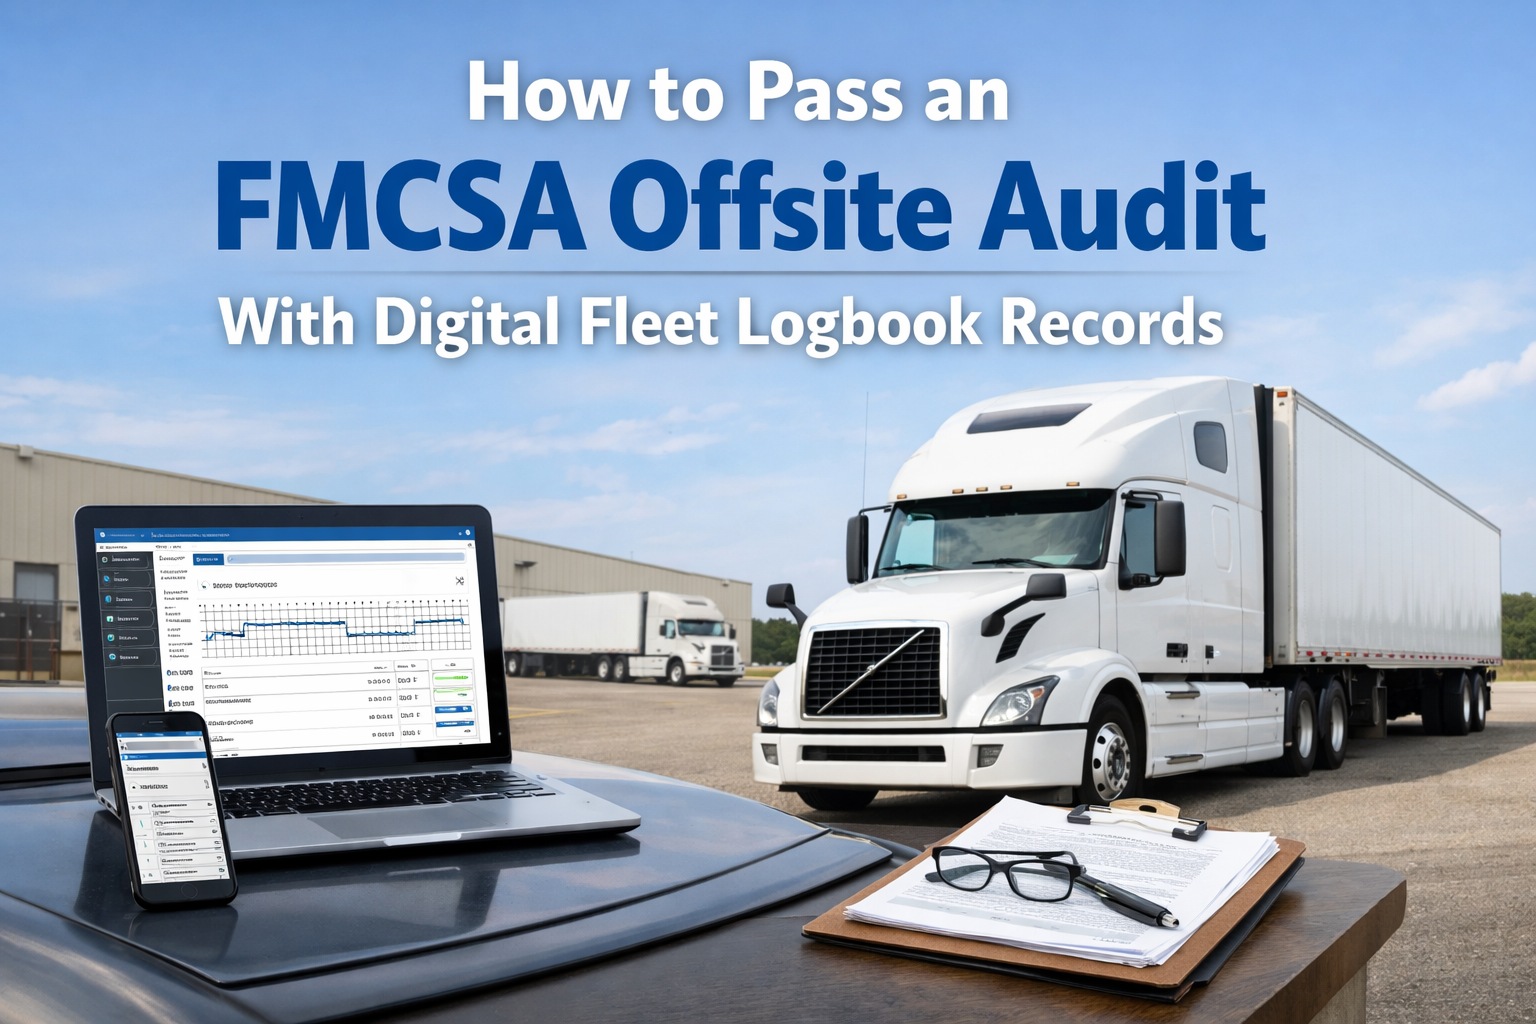
DVIR Completion Rate
Completed DVIRs / Required DVIRs per shift
Target:100%
Industry avg:78%
Audit risk:<90%
Dashboard action: Missing DVIR triggers instant alert to driver and supervisor. Terminal-level non-compliance visible to fleet manager within the hour — not at month-end.
PM Compliance Rate
On-time PM completions / Scheduled PMs
Top quartile:95%+
Industry avg:61%
At-risk:<70%
Dashboard action: PM approaching due date sends 90/60/30-day lookahead alerts. Overdue PM auto-escalates to fleet manager. Vehicle flagged as dispatch-restricted until PM completed.
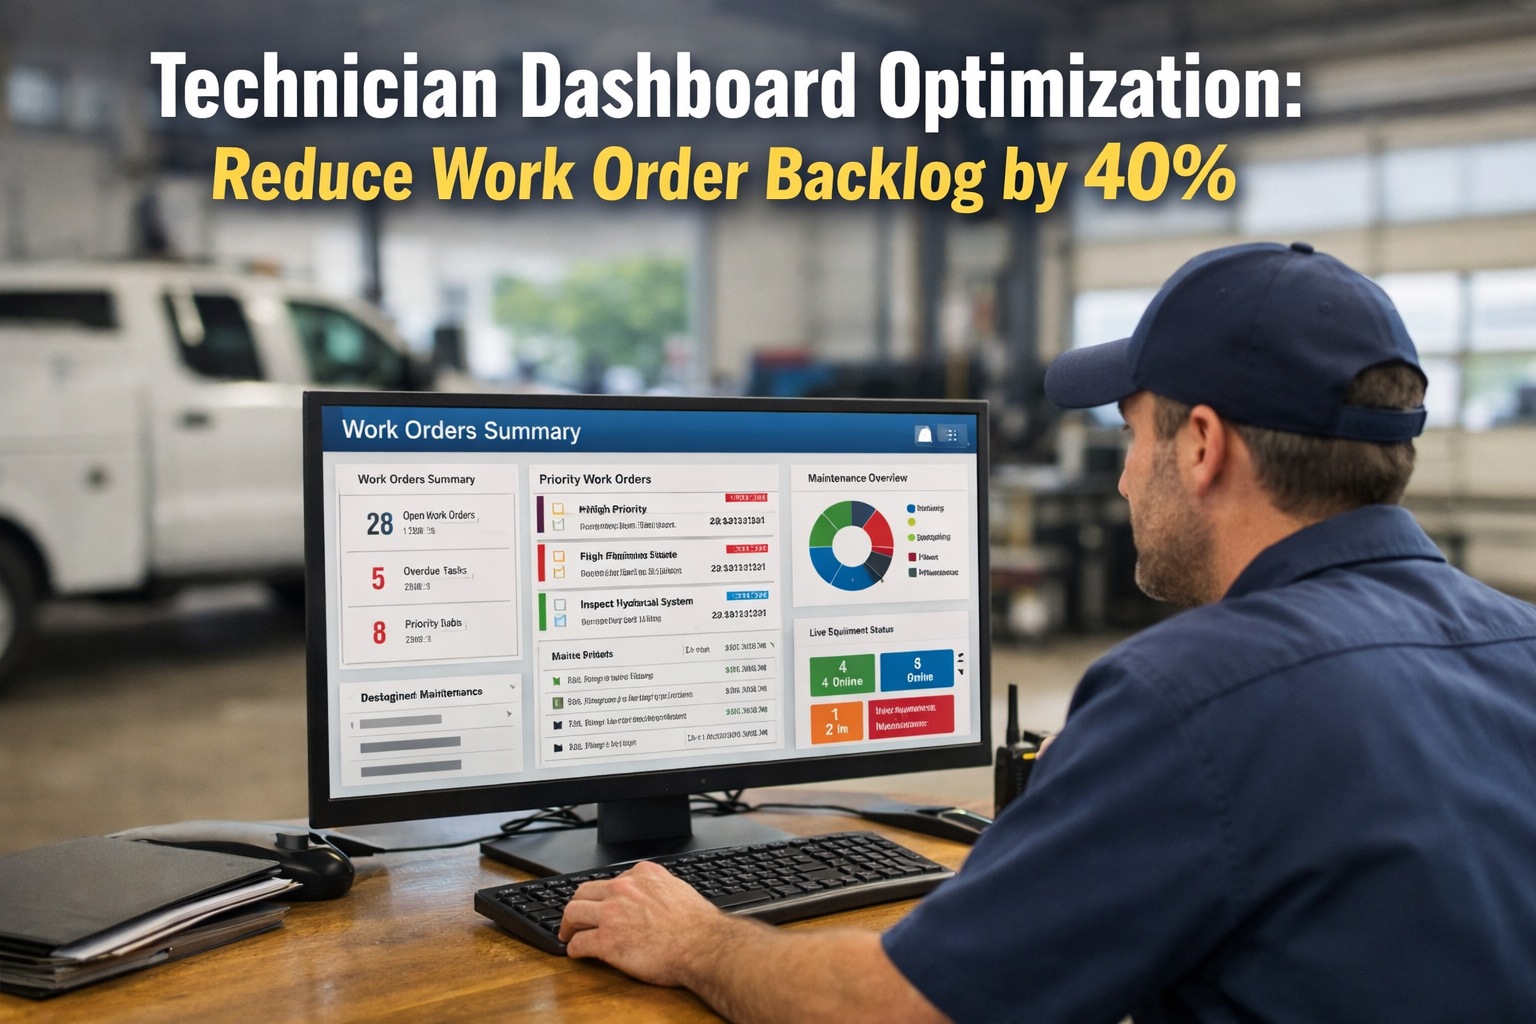
Defect-to-Repair Time
Time from inspection defect flagged to work order closed
Top quartile:<4 hrs
Average:18 hrs
Paper fleets:30+ hrs
Dashboard action: HVI auto-generates work orders from inspection defects. Dashboard tracks open defects in real time. Critical defects (brakes, steering, tires) trigger immediate alerts.
Cost Per Mile
Total maintenance cost / Total miles driven
Benchmark:<$0.42
Medium-duty avg:$0.52
Problem fleet:>$0.65
Dashboard action: Per-vehicle CPM trending identifies the 10% of vehicles causing 50% of costs. Vehicles exceeding threshold flagged for repair-vs-replace analysis.
Fuel Efficiency
Miles driven / Gallons consumed (per driver and vehicle)
Well-maintained:6.5+ MPG
Average:5.8 MPG
Investigate:<5.2 MPG
Dashboard action: Fuel anomalies flagged instantly. Driver idle-time percentage tracked per shift. Declining MPG per vehicle correlated with maintenance needs — engine issues burn up to 10% more fuel.
Vehicle Availability Rate
Available vehicles / Total fleet vehicles
Top quartile:95%+
Average:87.6%
Underperforming:<85%
Dashboard action: Real-time count of vehicles in service, in maintenance, and out of service. The 7.4% gap between average and top quartile = 27 extra operating days per vehicle per year.
Inspection Thoroughness Score
Photo-verified items / Total checklist items (AI-assessed quality)
Target:95%+
Average:68%
Pencil-whipping:<50%
Dashboard action: AI detects rushed inspections (too fast for genuine walk-around), missing photos, and duplicate submissions. Drivers with consistently low thoroughness scores receive targeted coaching.
Before and After: What UI Improvements Change
Dashboard design is not cosmetic — it determines whether data drives decisions or collects dust. Here is what changes when a fleet moves from a traditional reporting interface to HVI's enhanced driver dashboard. Schedule a demo to see both views side by side with your data.
Data Freshness
Weekly CSV imports, 5–7 day lag
Continuous updates, same-shift visibility
KPI Hierarchy
40 metrics, equal visual weight, scroll-heavy
3–4 north stars at top, one-click drill-down
Driver Visibility
Drivers never see their own data
Personal scorecard visible after every shift
Alert System
Threshold crossed → email buried in inbox
Threshold crossed → workflow auto-initiated
Mobile Access
Desktop-only, requires VPN or office visit
Mobile-first, any device, offline-capable
Benchmarking
No context — numbers without comparison
Industry benchmarks and peer comparison built in
Inspection Integration
Inspection data in separate system
DVIR, defects, and repairs feed dashboard KPIs live
How Driver Scorecards Change Behavior
The most powerful dashboard feature is the one that faces the driver — not the manager. When drivers see their own performance data, behavior changes without management intervention.
Inspection Thoroughness
92%
Harsh Events (this week)
3 events
Fuel Efficiency vs. Fleet Avg
+4% above avg
The Dashboard Is the Management System
An enhanced driver dashboard is not a reporting upgrade — it is a management system that makes every KPI visible, every threshold actionable, and every driver accountable in real time. The fleets achieving 95%+ vehicle availability, declining cost-per-mile, and clean DOT audits are not running separate spreadsheet reviews — they are running their operation through a dashboard that connects inspection data, maintenance workflows, driver behavior, and compliance documentation into one live view. HVI provides this dashboard purpose-built for heavy vehicle fleets — with the KPIs, the benchmarks, the driver scorecards, and the action-linked workflows that turn data into decisions. Start free and see your fleet's KPIs live within the first week.
Transform Your Fleet Dashboard Today
Real-time KPIs. Driver scorecards. Action-linked alerts. Inspection-to-maintenance integration. All on one platform — trusted by 25,000+ users worldwide.
Frequently Asked Questions
Q: What KPIs should a fleet dashboard prioritize?
Start with 3–4 "north star" KPIs: cost per mile, vehicle availability, PM compliance rate, and driver safety score. These four have the strongest correlation to fleet profitability and safety outcomes. Add DVIR completion rate, defect-to-repair time, fuel efficiency, and inspection thoroughness as secondary drill-downs. More than 8–10 tracked KPIs creates dashboard overload that reduces action rather than increasing it.
Q: How does HVI's dashboard differ from telematics dashboards?
Telematics dashboards (Samsara, Geotab, Motive) focus on GPS location, driver behavior, and ELD compliance. HVI's dashboard integrates inspection data, DVIR completion, defect tracking, maintenance workflows, and compliance documentation — the operational layer that telematics platforms handle as add-ons. Many fleets use HVI alongside their telematics provider for complete visibility.
Book a demo to see both working together.
Q: Can drivers see their own performance data?
Yes — HVI provides individual driver scorecards showing safety score, DVIR completion, inspection thoroughness, harsh events, and fuel efficiency relative to fleet average. Research shows drivers who see their own data improve safety scores by 15–22% within 90 days without direct management intervention. Visibility drives accountability without surveillance.
Try it free.
Q: How quickly can I see KPIs after starting with HVI?
DVIR completion rate, inspection thoroughness, and defect-to-repair time are visible from day one — these come from HVI's inspection and maintenance workflows. PM compliance, cost per mile, and vehicle availability build accuracy over the first 30–60 days as maintenance history accumulates. Driver safety scores require telematics integration or begin from HVI's inspection behavior data.
Q: What ROI can I expect from dashboard improvements?
Fleets that move from spreadsheet reporting to real-time dashboards typically see 35–40% reduction in roadside violations, 15–20% insurance premium reduction from improved CSA scores, 70% faster response to emerging maintenance issues, and measurable fuel savings from driver behavior visibility. Most fleets achieve positive ROI within 3–6 months of implementation.